plotDiagnostics
Plot diagnostics of nonlinear regression model
Syntax
Description
plotDiagnostics creates a plot of observation
diagnostics such as leverage or Cook's distance statistics to identify outliers and
influential observations.
plotDiagnostics( creates a
leverage plot of the nonlinear regression model (mdl)mdl)
observations. A dotted line in the plot represents the recommended threshold
values.
plotDiagnostics(___,
specifies additional options using one or more name-value arguments in addition
to any of the input argument combinations in the previous syntaxes. For example,
you can specify the marker symbol and size for the data points.Name,Value)
h = plotDiagnostics(___)h to modify the properties of a specific line or
contour after you create the plot. For a list of properties, see Line Properties and Contour Properties.
Examples
Nonlinear Model Leverage Plot
Create a leverage plot of a fitted nonlinear model, and find the points with high leverage.
Load the reaction data and fit a model of the reaction rate as a function of reactants.
load reaction
mdl = fitnlm(reactants,rate,@hougen,[1 .05 .02 .1 2]);
Create a leverage plot of the fitted model.
plotDiagnostics(mdl)

Use data tips to examine the observation with high leverage. A data tip appears when you hover over a data point.
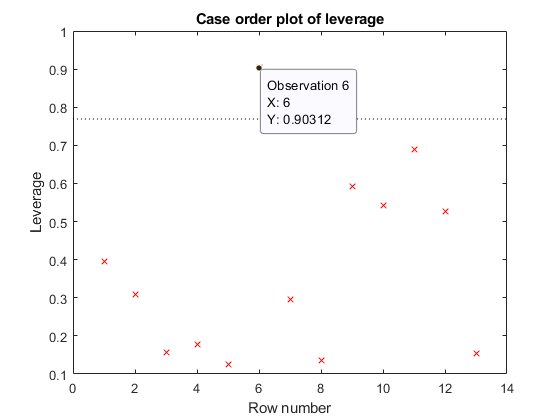
Alternatively, find the high-leverage observation at the command line.
find(mdl.Diagnostics.Leverage > 0.8)
ans =

     6
Input Arguments
plottype — Type of plot
'leverage' (default) | 'contour' | 'cookd'
Type of plot, specified as one of the values in this table.
| Value | Plot Type | Dotted Reference Line in Plot | Purpose |
|---|---|---|---|
'contour' | Residual vs. leverage with overlaid contours of Cook's distance | Contours of Cook's distance | Identify observations with large residual values, high leverage, and large Cook's distance values. |
'cookd' | Cook's distance | Recommended threshold, computed by
3*mean(mdl.Diagnostics.CooksDistance) | Identify observations with large Cook's distance values. |
'leverage' | Leverage (Diagonal of Hat matrix) | Recommended threshold, computed by
2*p/n | Identify high leverage observations. |
For all plot types except 'contour', the
x-axis is the row number (case order) of
observations.
The Diagnostics property of
mdl contains the diagnostic values used by
plotDiagnostics to create plots.
For more information about observation diagnostics, see Cook’s Distance and Leverage.
ax — Target axes
Axes object
Since R2024a
Target axes, specified as an Axes object. If you do not specify the
axes, then plotDiagnostics uses the current axes
(gca).
Name-Value Arguments
Specify optional pairs of arguments as
Name1=Value1,...,NameN=ValueN, where Name is
the argument name and Value is the corresponding value.
Name-value arguments must appear after other arguments, but the order of the
pairs does not matter.
Before R2021a, use commas to separate each name and value, and enclose
Name in quotes.
Example: 'Color','blue','Marker','o'
Note
The graphical properties listed here are only a subset. For a complete list, see Line Properties. The specified properties determine the appearance of diagnostic data points.
Color — Line color
RGB triplet | hexadecimal color code | color name | short name
Line color, specified as the comma-separated pair consisting of 'Color' and
an RGB triplet, hexadecimal color code, color name, or short name for one of the
color options listed in the following table.
The 'Color' name-value pair argument also determines marker outline color and marker fill color if 'MarkerEdgeColor' is 'auto' (default) and 'MarkerFaceColor' is 'auto'.
For a custom color, specify an RGB triplet or a hexadecimal color code.
An RGB triplet is a three-element row vector whose elements specify the intensities of the red, green, and blue components of the color. The intensities must be in the range
[0,1], for example,[0.4 0.6 0.7].A hexadecimal color code is a string scalar or character vector that starts with a hash symbol (
#) followed by three or six hexadecimal digits, which can range from0toF. The values are not case sensitive. Therefore, the color codes"#FF8800","#ff8800","#F80", and"#f80"are equivalent.
Alternatively, you can specify some common colors by name. This table lists the named color options, the equivalent RGB triplets, and hexadecimal color codes.
| Color Name | Short Name | RGB Triplet | Hexadecimal Color Code | Appearance |
|---|---|---|---|---|
"red" | "r" | [1 0 0] | "#FF0000" |
|
"green" | "g" | [0 1 0] | "#00FF00" |
|
"blue" | "b" | [0 0 1] | "#0000FF" |
|
"cyan"
| "c" | [0 1 1] | "#00FFFF" |
|
"magenta" | "m" | [1 0 1] | "#FF00FF" |
|
"yellow" | "y" | [1 1 0] | "#FFFF00" |
|
"black" | "k" | [0 0 0] | "#000000" |
|
"white" | "w" | [1 1 1] | "#FFFFFF" |
|
"none" | Not applicable | Not applicable | Not applicable | No color |
Here are the RGB triplets and hexadecimal color codes for the default colors MATLAB® uses in many types of plots.
| RGB Triplet | Hexadecimal Color Code | Appearance |
|---|---|---|
[0 0.4470 0.7410] | "#0072BD" |
|
[0.8500 0.3250 0.0980] | "#D95319" |
|
[0.9290 0.6940 0.1250] | "#EDB120" |
|
[0.4940 0.1840 0.5560] | "#7E2F8E" |
|
[0.4660 0.6740 0.1880] | "#77AC30" |
|
[0.3010 0.7450 0.9330] | "#4DBEEE" |
|
[0.6350 0.0780 0.1840] | "#A2142F" |
|
Example: 'Color','blue'
LineWidth — Line width
positive value
Line width, specified as the comma-separated pair consisting of 'LineWidth'
and a positive value in points. If the line has markers, then the line width also
affects the marker edges.
Example: 'LineWidth',0.75
Marker — Marker symbol
'o' | '+' | '*' | '.' | 'x' | ...
Marker symbol, specified as the comma-separated pair consisting of 'Marker'
and one of the values in this table.
| Marker | Description | Resulting Marker |
|---|---|---|
"o" | Circle |
|
"+" | Plus sign |
|
"*" | Asterisk |
|
"." | Point |
|
"x" | Cross |
|
"_" | Horizontal line |
|
"|" | Vertical line |
|
"square" | Square |
|
"diamond" | Diamond |
|
"^" | Upward-pointing triangle |
|
"v" | Downward-pointing triangle |
|
">" | Right-pointing triangle |
|
"<" | Left-pointing triangle |
|
"pentagram" | Pentagram |
|
"hexagram" | Hexagram |
|
"none" | No markers | Not applicable |
Example: 'Marker','+'
MarkerEdgeColor — Marker outline color
'auto' (default) | 'none' | RGB triplet | hexadecimal color code | color name | short name
Marker outline color, specified as the comma-separated pair consisting of
'MarkerEdgeColor' and an RGB triplet, hexadecimal color code,
color name, or short name for one of the color options listed in the
Color name-value pair argument.
The default value of 'auto' uses the same color specified by
using 'Color'.
Example: 'MarkerEdgeColor','blue'
MarkerFaceColor — Marker fill color
'none' (default) | 'auto' | RGB triplet | hexadecimal color code | color name | short name
Marker fill color, specified as the comma-separated pair consisting of
'MarkerFaceColor' and an RGB triplet, hexadecimal color code,
color name, or short name for one of the color options listed in the
Color name-value pair argument.
The 'auto' value uses the same color specified by using 'Color'.
Example: 'MarkerFaceColor','blue'
MarkerSize — Marker size
6 (default) | positive value
Marker size, specified as the comma-separated pair consisting of 'MarkerSize' and a positive value in points.
Example: 'MarkerSize',2
Output Arguments
More About
Tips
The data cursor displays the values of the selected plot point in a data tip (small text box located next to the data point). The data tip includes the x-axis and y-axis values for the selected point, along with the observation name or number.
References
[1] Neter, J., M. H. Kutner, C. J. Nachtsheim, and W. Wasserman. Applied Linear Statistical Models, Fourth Edition. Irwin, Chicago, 1996.
Version History
Introduced in R2012aYou can also select a web site from the following list:
Americas
- América Latina (Español)
- Canada (English)
- United States (English)
Europe
- Belgium (English)
- Denmark (English)
- Deutschland (Deutsch)
- España (Español)
- Finland (English)
- France (Français)
- Ireland (English)
- Italia (Italiano)
- Luxembourg (English)
- Netherlands (English)
- Norway (English)
- Österreich (Deutsch)
- Portugal (English)
- Sweden (English)
- Switzerland
- United Kingdom (English)