Create Contour Plot of Grayscale Image
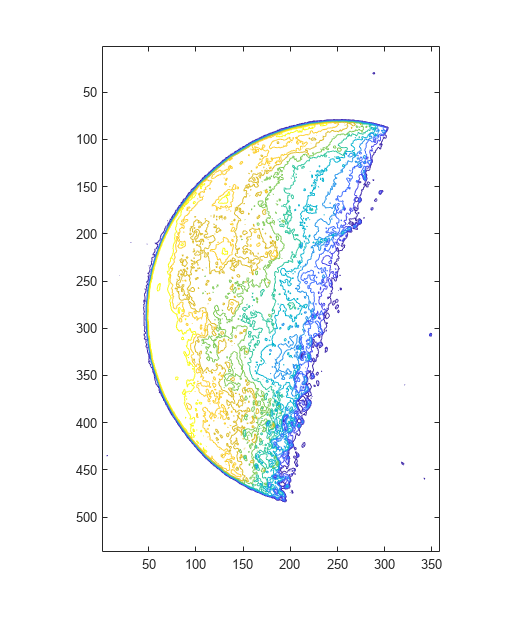
This example shows how to create a contour plot of an image. A contour is a path in an image along which the image intensity values are equal to a constant. You can create a contour plot of the data in a grayscale image using the imcontour function. This function is similar to the contour function in MATLAB®, but it automatically sets up the axes so their orientation and aspect ratio match the image.
Read and display a grayscale image.
I = imread("moon.tif");
imshow(I)
Create a contour plot of the image with ten contour levels using imcontour.
[C,h] = imcontour(I,10);

Display the levels that the imcontour function selected.
h.LevelList
ans = 1×10

    23    46    69    92   115   138   161   184   207   230
To label the levels of the contours, use the clabel function. Zoom in to see the contour details.
clabel(C,h)
xlim([160 200])
ylim([360 400])

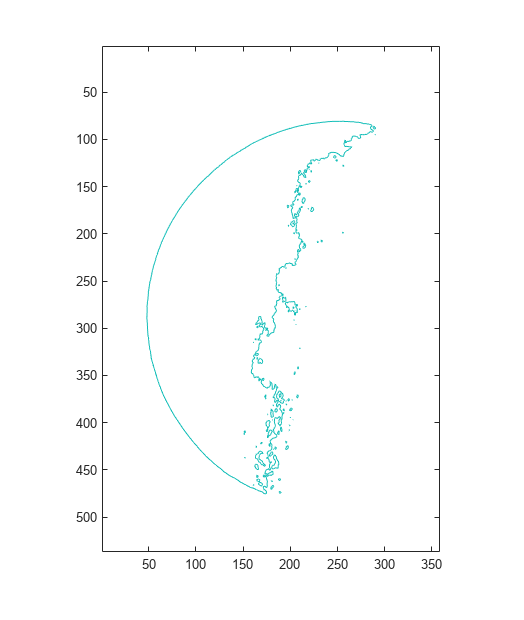
Display a single contour at level 128.
imcontour(I,[128 128]);
