Using Graphics Smoothing
This example shows how to use graphics and font smoothing in your plots.
What is Graphics Smoothing?
Graphics smoothing improves the appearance of graphics in plots. Smoothing removes jagged edges that result from using pixels or dots to represent continuous objects. Techniques used for graphics smoothing include multi-sampling and anti-aliasing.
Graphics Smoothing in a Figure
Graphics smoothing is controlled in a figure by using the GraphicsSmoothing property. By default, the GraphicsSmoothing property is set to 'on'.
f = figure;
surf(peaks)

You can turn off graphics smoothing by setting the GraphicsSmoothing property to 'off'.
f.GraphicsSmoothing = 'off';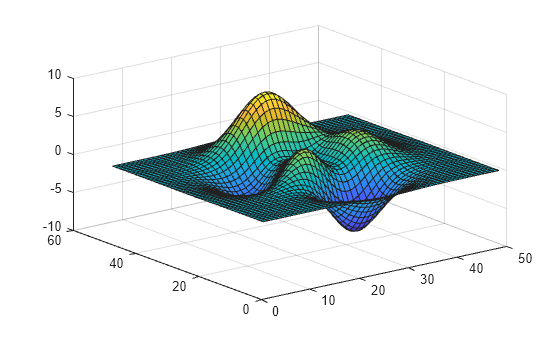
Font Smoothing for Text and Axes Objects
The FontSmoothing property of a text or an axes object controls how text is rendered. When FontSmoothing is set to 'on', text will be drawn with smoothed edges. Font smoothing is 'on' by default.
t = text(14,27,-8.5, 'Minimum of Peaks');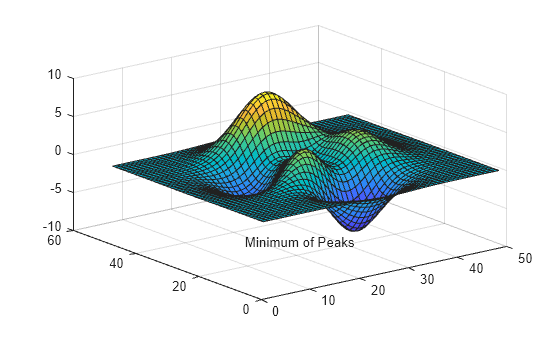
t.FontSmoothing = 'off';
Why Turn Graphics Smoothing Off?
Without graphics smoothing, horizontal and vertical lines will appear sharper. Certain chart types may look better when graphics smoothing is turned off. Similarly, turning off font smoothing may make text using small fonts appear clearer.
pcolor(rand(6))
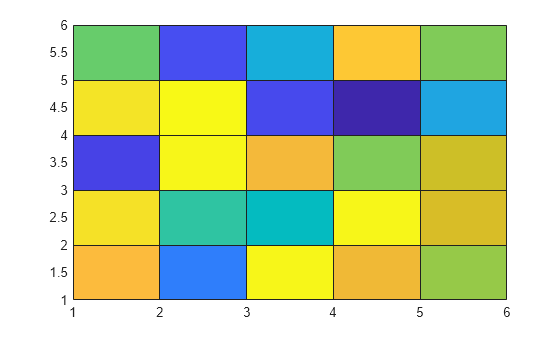
ax = gca;                       % get current axes
ax.FontSmoothing = 'off';       % turn off axes font smoothing

f.GraphicsSmoothing = 'off'; % turn off figure graphics smoothing
You can also select a web site from the following list
Americas
- América Latina (Español)
- Canada (English)
- United States (English)
Europe
- Belgium (English)
- Denmark (English)
- Deutschland (Deutsch)
- España (Español)
- Finland (English)
- France (Français)
- Ireland (English)
- Italia (Italiano)
- Luxembourg (English)
- Netherlands (English)
- Norway (English)
- Österreich (Deutsch)
- Portugal (English)
- Sweden (English)
- Switzerland
- United Kingdom (English)
Asia Pacific
- Australia (English)
- India (English)
- New Zealand (English)
- 中国
- 日本Japanese (日本語)
- 한국Korean (한국어)