getLayout
Class: matlab.graphics.chartcontainer.ChartContainer
Namespace: matlab.graphics.chartcontainer
Get tiled chart layout for chart container subclass
Syntax
tcl = getLayout(obj)
Description
Input Arguments
Output Arguments
Examples
Define a class called CartPolarPlot that plots data in Cartesian
and polar coordinates.
To define the class, create a file called CartPolarPlot.m that
contains the following class definition with these features:
Three public properties:
XDataandYDatato store the coordinate data, andLineColorto control the color of the linesFour private properties that store the two lines and axes objects
A
setupmethod that configures the layout, creates the axes, and initializes the twoLineobjectsAn
updatemethod that updates theLineobjects when the user changes the value of one or more public properties
classdef CartPolarPlot < matlab.graphics.chartcontainer.ChartContainer
    properties
        XData (1,:) double = NaN
        YData (1,:) double = NaN
        LineColor (1,3) double {mustBeGreaterThanOrEqual(LineColor,0),...
            mustBeLessThanOrEqual(LineColor,1)} = [.5 0 1]
    end
    properties(Access = private,Transient,NonCopyable)
        CartesianLine (1,1) matlab.graphics.chart.primitive.Line
        PolarLine (1,1) matlab.graphics.chart.primitive.Line
        CartesianAx (1,1) matlab.graphics.axis.Axes
        PolarAx (1,1) matlab.graphics.axis.PolarAxes
    end

    methods(Access = protected)
        function setup(obj)
            % Get the layout and create the axes
            tcl = getLayout(obj);
            tcl.GridSize = [1 2];
            obj.CartesianAx = axes(tcl);
            obj.PolarAx = polaraxes(tcl);

            % Move the polar axes to the second tile
            obj.PolarAx.Layout.Tile = 2;

            % Create the Cartesian and polar lines
            obj.CartesianLine = plot(obj.CartesianAx,NaN,NaN);
            obj.PolarLine = polarplot(obj.PolarAx,NaN,NaN);
        end
        function update(obj)
            % Update Cartesian line
            obj.CartesianLine.XData = obj.XData;
            obj.CartesianLine.YData = obj.YData;
            obj.CartesianLine.Color = obj.LineColor;

            % Update polar line
            obj.PolarLine.Color = obj.LineColor;
            obj.PolarLine.ThetaData = obj.XData;
            obj.PolarLine.RData = obj.YData;
        end
    end
end
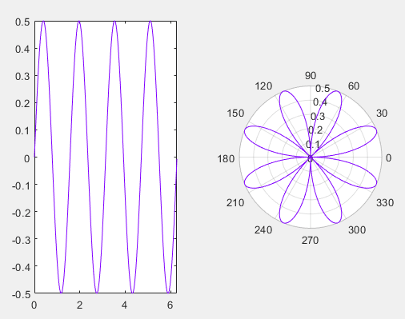
Next, create a set of x- and y-coordinates.
Then plot the coordinates by calling the CartPolarPlot constructor
method with the 'XData' and 'YData' name-value
pair arguments.
x = 0:0.01:2*pi;
y = sin(2*x).*cos(2*x);
CartPolarPlot('XData',x,'YData',y);
Version History
Introduced in R2020a