step
System object: phased.MVDREstimator
Namespace: phased
Perform spatial spectrum estimation
Syntax
Y = step(H,X)

[Y,ANG] = step(H,X)
Description
Note
Starting in R2016b, instead of using the step method
to perform the operation defined by the System object™, you can
call the object with arguments, as if it were a function. For example, y
= step(obj,x) and y = obj(x) perform
equivalent operations.
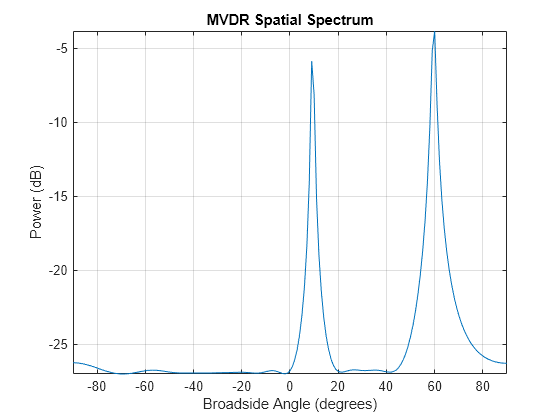
Y = step(H,X) estimates the spatial spectrum
from X using the estimator H. X is
a matrix whose columns correspond to channels. Y is
a column vector representing the magnitude of the estimated spatial
spectrum.
The size of the first dimension of the input matrix can vary to simulate a changing signal length. A size change can occur, for example, in the case of a pulse waveform with variable pulse repetition frequency.
[Y,ANG] = step(H,X) returns additional
output ANG as the signal’s direction of
arrival (DOA) when the DOAOutputPort property is
true. ANG is a row vector of the estimated broadside
angles (in degrees).
Note
The object performs an initialization the first time the object is executed. This
initialization locks nontunable properties
and input specifications, such as dimensions, complexity, and data type of the input data.
If you change a nontunable property or an input specification, the System object issues an error. To change nontunable properties or inputs, you must first
call the release method to unlock the object.

