FFT Analyzer
The Specialized Power Systems library will be removed in R2026a. Use the Simscape™ Electrical™ blocks and functions instead. For more information on updating your models, see Upgrade Specialized Power Systems Models to use Simscape Electrical Blocks.
Description
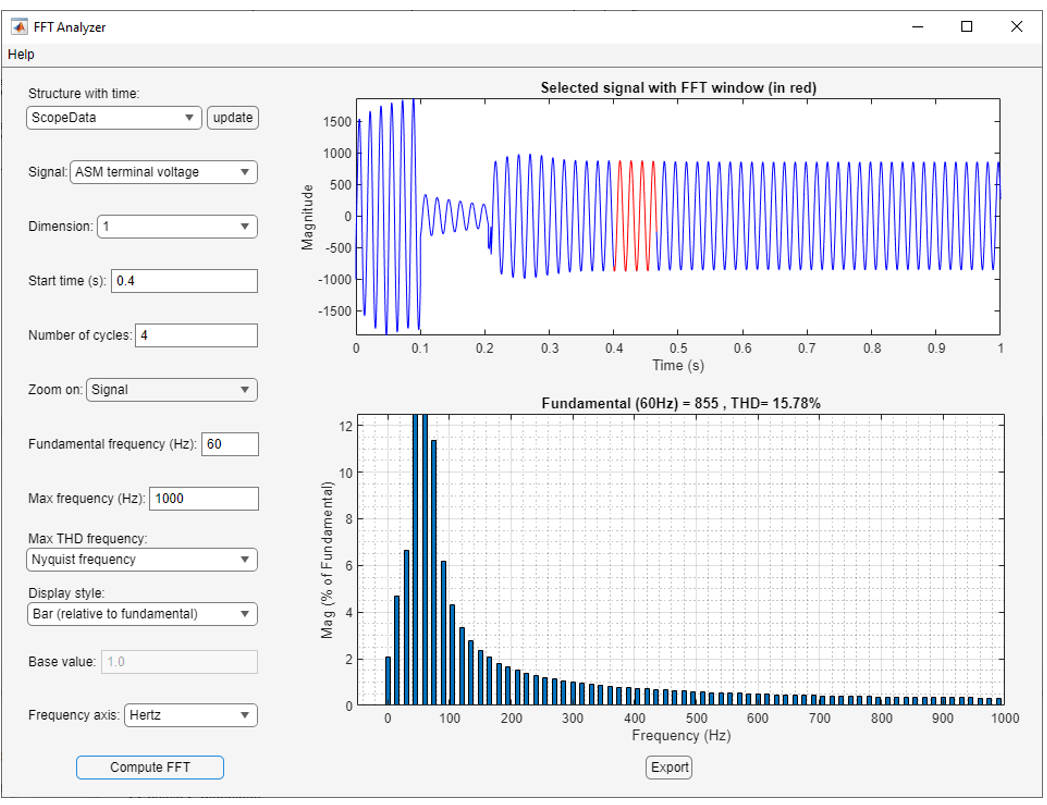
The FFT Analyzer app allows you to perform Fourier analysis of simulation data and provides access to all the simulation data that are defined as structure-with-time variables in your workspace. The app displays the spectrum as a bar graph or as a list in percentages relative to a base value or to the DC component of the signal.
The FFT Analyzer specifically works with data from Specialized Power Systems models.
Open the FFT Analyzer App
powergui Block Parameters dialog box: On the Apps tab, click FFT Analyzer.
MATLAB® command prompt: Enter
powerFFT
Parameters
Refreshes the list of simulation data variables in the Structure with time drop-down menu. Refreshing allows you to import additional simulation signals from the workspace without the need to close and reopen the tool. If the workspace contains no structure-with-time variables, the drop-down menu shows Empty list.
Lists all the simulation data variables that are present in your workspace. Use the drop-down list to select the structure-with-time variable that you want to analyze. If the workspace contains no structure-with-time variables, the list shows Empty list. Structure-with-time variables are generated by the Scope and To Workspace blocks in your model.
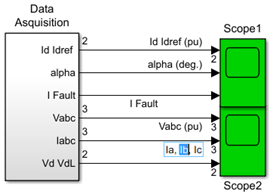
Lists the signal of the structure-with-time variable specified in the Structure with time drop-down menu. Structure-with-time variables that have multiple signals can be generated by a Scope block that has multiple input ports. The list shows the name of the signals as they are labeled in your models. If a signal is not labeled, such as the third signal of Scope2 in this figure, the list shows unnamed (input 3).

Indicates the index of the signal specified by the Signal parameter. For example, the Dimension parameter allows you to select the Ib measurement of a three-phase signal connected to the second input of Scope2 block.
Select Signal to display the complete view of the signal
selected by the Structure with time, Signal,
and Dimension parameters in blue in the upper plot. The FFT window
that is specified by the Start time, Number of
cycles, and Fundamental frequency parameters is
displayed in red.
Select FFT window to display only the portion of the
selected signal where the FFT analysis is performed in the upper plot.
Specifies the start times for the FFT analysis. The FFT analysis is performed on the portion of the signal starting at the specified time and for the specified number of cycles.
Specifies the number of cycles of the selected signal to analyze for the FFT analysis.
Specifies the fundamental frequency, in Hz, as a reference frequency for the FFT analysis.
Specifies the maximum frequency, in Hz, for the FFT analysis.
Select Nyquist frequency to compute the THD to the
maximum frequency equal to the Nyquist frequency. The Nyquist frequency is half the
sampling frequency of the selected signal.
Select Same as Max frequency to compute the THD to the
maximum frequency equal to the frequency specified in the Max frequency
(Hz) parameter.
The THD calculation includes all the inter harmonics of the selected input signal.
Select Bar (relative to fundamental) to display the
spectrum as a bar graph relative to the fundamental frequency. Select Bar
(relative to specified base) to display the spectrum as a bar graph
relative to the base defined by the Base value parameter. Select
Bar (relative to DC component) to display the spectrum as a
bar graph relative to the DC component of the signal.
Select List (relative to fundamental) to display the
spectrum as a list in percentages relative to the fundamental or DC component. Select
List (relative to specified base) to display the spectrum
as a list in percentages relative to the base value defined by the Base
value parameter. Select List (relative to DC
component) to display the spectrum as a list relative to the DC
component of the signal.
Enter a base value for the display of harmonics.
Select Hertz to display the spectrum frequency axis in
hertz. Select Harmonic order to display the spectrum
frequency axis in harmonic order relative to the fundamental frequency.
Displays the FFT analysis results for the selected simulation data signal in the FFT graph.
Version History
Introduced in R2021a