Compare Handwritten Shapes Using Procrustes Analysis
This example shows how to use Procrustes analysis to compare two handwritten number threes. Visually and analytically explore the effects of forcing size and reflection changes.
Load and Display the Original Data
Input landmark data for two handwritten number threes.
A = [11 39;17 42;25 42;25 40;23 36;19 35;30 34;35 29;...
30 20;18 19];
B = [15 31;20 37;30 40;29 35;25 29;29 31;31 31;35 20;...
29 10;25 18];
Create X and Y from A and B , moving B to the side to make each shape more visible.
X = A;
Y = B + repmat([25 0], 10,1);
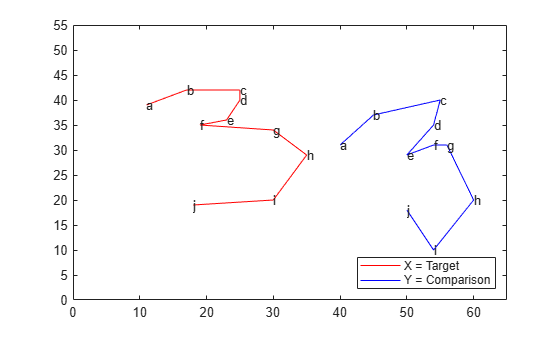
Plot the shapes, using letters to designate the landmark points. Lines in the figure join the points to indicate the drawing path of each shape.
plot(X(:,1), X(:,2),'r-', Y(:,1), Y(:,2),'b-');
text(X(:,1), X(:,2),('abcdefghij')')
text(Y(:,1), Y(:,2),('abcdefghij')')
legend('X = Target','Y = Comparison','location','SE')
xlim([0 65]);
ylim([0 55]);
Calculate the Best Transformation
Use Procrustes analysis to find the transformation that minimizes distances between landmark data points.
[d,Z,tr] = procrustes(X,Y);
The outputs of the function are d (a standardized dissimilarity measure), Z (a matrix of the transformed landmarks), and tr (a structure array of the computed transformation with fields T , b , and c which correspond to the transformation equation).
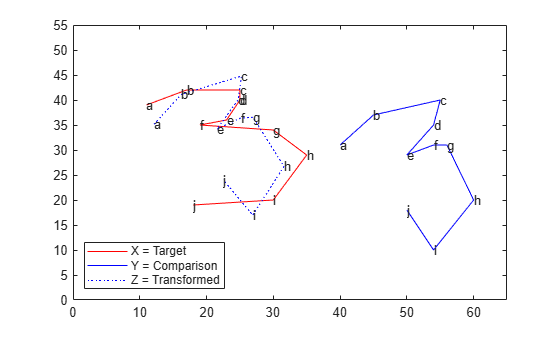
Visualize the transformed shape, Z , using a dashed blue line.
plot(X(:,1), X(:,2),'r-', Y(:,1), Y(:,2),'b-',...
Z(:,1),Z(:,2),'b:');
text(X(:,1), X(:,2),('abcdefghij')')
text(Y(:,1), Y(:,2),('abcdefghij')')
text(Z(:,1), Z(:,2),('abcdefghij')')
legend('X = Target','Y = Comparison',...
'Z = Transformed','location','SW')
xlim([0 65]);
ylim([0 55]);
Examine the Similarity of the Two Shapes
Use two different numerical values, the dissimilarity measure d and the scaling measure b , to assess the similarity of the target shape and the transformed shape.
The dissimilarity measure d gives a number between 0 and 1 describing the difference between the target shape and the transformed shape. Values near 0 imply more similar shapes, while values near 1 imply dissimilarity.
d
d =
0.1502
The small value of d in this case shows that the two shapes are similar. procrustes calculates d by comparing the sum of squared deviations between the set of points with the sum of squared deviations of the original points from their column means.
numerator = sum(sum((X-Z).^2))
numerator =
166.5321
denominator = sum(sum((X-mean(X)).^2))
denominator =
1.1085e+03
ratio = numerator/denominator
ratio =
0.1502
The resulting measure d is independent of the scale of the size of the shapes and takes into account only the similarity of landmark data.
Examine the size similarity of the shapes.
tr.b
ans =
0.9291
The sizes of the target and comparison shapes in the previous figure appear similar. This visual impression is reinforced by the value of b = % 0.93, which implies that the best transformation results in shrinking the comparison shape by a factor .93 (only 7%).
Restrict the Form of the Transformations
Explore the effects of manually adjusting the scaling and reflection coefficients.
Force b to equal 1 (set 'Scaling' to false) to examine the amount of dissimilarity in size of the target and transformed figures.
ds = procrustes(X,Y,'Scaling',false)ds = 0.1552
In this case, setting 'Scaling ' to false increases the calculated value of d only 0.0049, which further supports the similarity in the size of the two number threes. A larger increase in d would have indicated a greater size discrepancy.
This example requires only a rotation, not a reflection, to align the shapes. You can show this by observing that the determinant of the matrix T is 1 in this analysis.
det(tr.T)
ans =
1.0000
If you need a reflection in the transformation, the determinant of T is -1. You can force a reflection into the transformation as follows.
[dr,Zr,trr] = procrustes(X,Y,'Reflection',true);
dr
dr = 0.8130
The d value increases dramatically, indicating that a forced reflection leads to a poor transformation of the landmark points. A plot of the transformed shape shows a similar result.
plot(X(:,1), X(:,2),'r-', Y(:,1), Y(:,2),'b-',...
Zr(:,1),Zr(:,2),'b:');
text(X(:,1), X(:,2),('abcdefghij')')
text(Y(:,1), Y(:,2),('abcdefghij')')
text(Zr(:,1), Zr(:,2),('abcdefghij')')
legend('X = Target','Y = Comparison',...
'Z = Transformed','Location','SW')
xlim([0 65]);
ylim([0 55]);
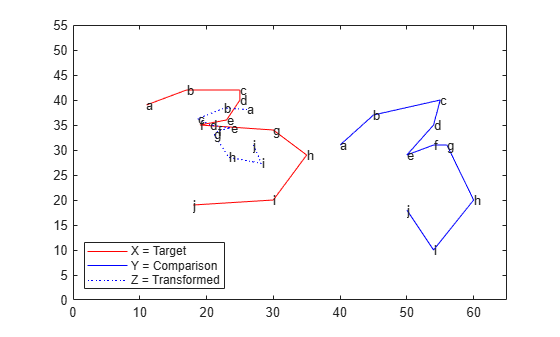
The landmark data points are now further away from their target counterparts. The transformed three is now an undesirable mirror image of the target three.
It appears that the shapes might be better matched if you flipped the transformed shape upside down. Flipping the shapes would make the transformation even worse, however, because the landmark data points would be further away from their target counterparts. From this example, it is clear that manually adjusting the scaling and reflection parameters is generally not optimal.