lsaModel
Latent semantic analysis (LSA) model
Description
A latent semantic analysis (LSA) model discovers relationships between documents and the words that they contain. An LSA model is a dimensionality reduction tool useful for running low-dimensional statistical models on high-dimensional word counts. If the model was fit using a bag-of-n-grams model, then the software treats the n-grams as individual words.
Creation
Create an LSA model using the fitlsa function.
Properties
Object Functions
transform | Transform documents into lower-dimensional space |
Examples
Fit a Latent Semantic Analysis model to a collection of documents.
Load the example data. The file sonnetsPreprocessed.txt contains preprocessed versions of Shakespeare's sonnets. The file contains one sonnet per line, with words separated by a space. Extract the text from sonnetsPreprocessed.txt, split the text into documents at newline characters, and then tokenize the documents.
filename = "sonnetsPreprocessed.txt";
str = extractFileText(filename);
textData = split(str,newline);
documents = tokenizedDocument(textData);
Create a bag-of-words model using bagOfWords.
bag = bagOfWords(documents)
bag =
  bagOfWords with properties:

        NumWords: 3092
          Counts: [154×3092 double]
      Vocabulary: ["fairest"    "creatures"    "desire"    "increase"    "thereby"    "beautys"    "rose"    "might"    "never"    "die"    "riper"    "time"    "decease"    "tender"    "heir"    "bear"    "memory"    "thou"    …    ] (1×3092 string)
    NumDocuments: 154
Fit an LSA model with 20 components.
numComponents = 20;
mdl = fitlsa(bag,numComponents)
mdl =
  lsaModel with properties:

              NumComponents: 20
           ComponentWeights: [2.7866e+03 515.5889 443.6428 316.4191 295.4065 261.8927 226.1649 186.2160 170.6413 156.6033 151.5275 146.2553 141.6741 135.5318 134.1694 128.9931 124.2382 122.2931 116.5035 116.2590]
             DocumentScores: [154×20 double]
                 WordScores: [3092×20 double]
                 Vocabulary: ["fairest"    "creatures"    "desire"    "increase"    "thereby"    "beautys"    "rose"    "might"    "never"    "die"    "riper"    "time"    "decease"    "tender"    "heir"    "bear"    "memory"    …    ] (1×3092 string)
    FeatureStrengthExponent: 2
Transform new documents into lower dimensional space using the LSA model.
newDocuments = tokenizedDocument([
    "what's in a name? a rose by any other name would smell as sweet."
    "if music be the food of love, play on."]);
dscores = transform(mdl,newDocuments)
dscores = 2×20
0.1338 0.1623 0.1680 -0.0541 -0.2464 0.0134 -0.2604 0.0205 -0.1127 0.0627 0.3311 -0.2327 0.1689 -0.2695 0.0228 0.1241 0.1198 0.2535 -0.0607 0.0305
0.2547 0.5576 -0.0095 0.5660 -0.0643 0.1236 0.0082 -0.0522 0.0690 -0.0330 0.0385 0.0803 -0.0373 0.0384 -0.0005 0.1943 0.0207 0.0278 0.0001 -0.0469
Create a bag-of-words model from some text data.
str = [
    "I enjoy ham, eggs and bacon for breakfast."
    "I sometimes skip breakfast."
    "I eat eggs and ham for dinner."
    ];
documents = tokenizedDocument(str);
bag = bagOfWords(documents);
Fit an LSA model with two components. Set the feature strength exponent to 0.5.
numComponents = 2;
exponent = 0.5;
mdl = fitlsa(bag,numComponents, ...
    FeatureStrengthExponent=exponent)
mdl =
lsaModel with properties:
NumComponents: 2
ComponentWeights: [16.2268 4.0000]
DocumentScores: [3×2 double]
WordScores: [14×2 double]
Vocabulary: ["I" "enjoy" "ham" "," "eggs" "and" "bacon" "for" "breakfast" "." "sometimes" "skip" "eat" "dinner"]
FeatureStrengthExponent: 0.5000
Calculate the cosine distance between the documents score vectors using pdist. View the distances in a matrix D using squareform. D(i,j) denotes the distance between document i and j.
dscores = mdl.DocumentScores;
distances = pdist(dscores,"cosine");
D = squareform(distances)
D = 3×3
0 0.6244 0.1489
0.6244 0 1.1670
0.1489 1.1670 0
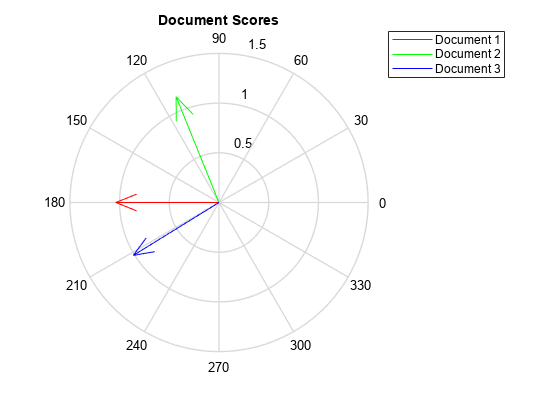
Visualize the similarity between documents by plotting the document score vectors in a compass plot. Convert the document score vectors to polar coordinates before passing them to compassplot.
[dscoresTheta,dscoresRho] = cart2pol(dscores(:,1),dscores(:,2));

figure
compassplot(dscoresTheta(1),dscoresRho(1))
hold on
compassplot(dscoresTheta(2),dscoresRho(2))
compassplot(dscoresTheta(3),dscoresRho(3))
hold off
title("Document Scores")
legend(["Document 1" "Document 2" "Document 3"],Location="bestoutside")
Version History
Introduced in R2017b