DependencyChart Properties
DependencyChart properties control the appearance and behavior
of a DependencyChart object. By changing property values, you can modify
certain aspects of the dependency chart.
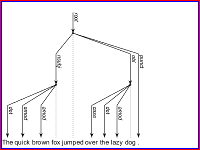
To create a DependencyChart object, use sentenceChart.
Color and Styling
Display orientation of the sentence, specified as one of these values:
"horizontal"— Display the tokens horizontally with the tree reading from top to bottom."vertical"— Display the tokens vertically with the tree reading from left to right.
Dependency line width in points, specified as a positive scalar. One point equals 1/72 inch.
The line width cannot be thinner than the width of a pixel. If you set the line width to a value that is less than the width of a pixel on your system, the line displays as one pixel wide.
Note
If you do not specify LeaderLineWidth, then the function
automatically sets LeaderLineWidth to the value of
LineWidth. To change the dependency line width only, set
LeaderLineWidth to 0.5.
Dependency line color, specified as an RGB triplet or as a string scalar or character vector containing a color name.
RGB triplets and hexadecimal color codes are useful for specifying custom colors.
An RGB triplet is a three-element row vector whose elements specify the intensities of the red, green, and blue components of the color. The intensities must be in the range
[0,1]; for example,[0.4 0.6 0.7].A hexadecimal color code is a character vector or a string scalar that starts with a hash symbol (
#) followed by three or six hexadecimal digits, which can range from0toF. The values are not case sensitive. Thus, the color codes"#FF8800","#ff8800","#F80", and"#f80"are equivalent.
Alternatively, you can specify some common colors by name. This table lists the named color options, the equivalent RGB triplets, and hexadecimal color codes.
| Color Name | Short Name | RGB Triplet | Hexadecimal Color Code | Appearance |
|---|---|---|---|---|
"red" | "r" | [1 0 0] | "#FF0000" |
|
"green" | "g" | [0 1 0] | "#00FF00" |
|
"blue" | "b" | [0 0 1] | "#0000FF" |
|
"cyan"
| "c" | [0 1 1] | "#00FFFF" |
|
"magenta" | "m" | [1 0 1] | "#FF00FF" |
|
"yellow" | "y" | [1 1 0] | "#FFFF00" |
|
"black" | "k" | [0 0 0] | "#000000" |
|
"white" | "w" | [1 1 1] | "#FFFFFF" |
|
This table lists the default color palettes for plots in the light and dark themes.
| Palette | Palette Colors |
|---|---|
Before R2025a: Most plots use these colors by default. |
|
|
|
You can get the RGB triplets and hexadecimal color codes for these palettes using the orderedcolors and rgb2hex functions. For example, get the RGB triplets for the "gem" palette and convert them to hexadecimal color codes.
RGB = orderedcolors("gem");
H = rgb2hex(RGB);
Before R2023b: Get the RGB triplets using RGB =
get(groot,"FactoryAxesColorOrder").
Before R2024a: Get the hexadecimal color codes using H =
compose("#%02X%02X%02X",round(RGB*255)).
Dependency line style, specified as one of the options in this table.
| Line Style | Description | Resulting Line |
|---|---|---|
"-" | Solid line |
|
"--" | Dashed line |
|
":" | Dotted line |
|
"-." | Dash-dotted line |
|
"none" | No line | No line |
Leader line width in points, specified as a positive scalar. One point equals 1/72 inch.
The line width cannot be thinner than the width of a pixel. If you set the line width to a value that is less than the width of a pixel on your system, the line displays as one pixel wide.
Leader line color, specified as an RGB triplet or as a string scalar or character vector containing a color name.
RGB triplets and hexadecimal color codes are useful for specifying custom colors.
An RGB triplet is a three-element row vector whose elements specify the intensities of the red, green, and blue components of the color. The intensities must be in the range
[0,1]; for example,[0.4 0.6 0.7].A hexadecimal color code is a character vector or a string scalar that starts with a hash symbol (
#) followed by three or six hexadecimal digits, which can range from0toF. The values are not case sensitive. Thus, the color codes"#FF8800","#ff8800","#F80", and"#f80"are equivalent.
Alternatively, you can specify some common colors by name. This table lists the named color options, the equivalent RGB triplets, and hexadecimal color codes.
| Color Name | Short Name | RGB Triplet | Hexadecimal Color Code | Appearance |
|---|---|---|---|---|
"red" | "r" | [1 0 0] | "#FF0000" |
|
"green" | "g" | [0 1 0] | "#00FF00" |
|
"blue" | "b" | [0 0 1] | "#0000FF" |
|
"cyan"
| "c" | [0 1 1] | "#00FFFF" |
|
"magenta" | "m" | [1 0 1] | "#FF00FF" |
|
"yellow" | "y" | [1 1 0] | "#FFFF00" |
|
"black" | "k" | [0 0 0] | "#000000" |
|
"white" | "w" | [1 1 1] | "#FFFFFF" |
|
This table lists the default color palettes for plots in the light and dark themes.
| Palette | Palette Colors |
|---|---|
Before R2025a: Most plots use these colors by default. |
|
|
|
You can get the RGB triplets and hexadecimal color codes for these palettes using the orderedcolors and rgb2hex functions. For example, get the RGB triplets for the "gem" palette and convert them to hexadecimal color codes.
RGB = orderedcolors("gem");
H = rgb2hex(RGB);
Before R2023b: Get the RGB triplets using RGB =
get(groot,"FactoryAxesColorOrder").
Before R2024a: Get the hexadecimal color codes using H =
compose("#%02X%02X%02X",round(RGB*255)).
Leader line style, specified as one of the options in this table.
| Line Style | Description | Resulting Line |
|---|---|---|
"-" | Solid line |
|
"--" | Dashed line |
|
":" | Dotted line |
|
"-." | Dash-dotted line |
|
"none" | No line | No line |
Token and label font name, specified as a supported font name. For labels to display and print properly, you must choose a font that your system supports. The default font depends on the specific operating system and locale. For example, Windows® and Linux® systems in English localization use the Helvetica font by default.
Data Types: char | string
Token font size in points, specified as a positive scalar. One point equals 1/72 inch.
Note
If you do not specify the LabelFontSize option, then the function automatically sets the LabelFontSize option to 0.8*LineWidth. To change the token font size only, set the LabelFontSize option to 8.
Data Types: single | double | int8 | int16 | int32 | int64 | uint8 | uint16 | uint32 | uint64
Label font size in points, specified as a positive scalar. One point equals 1/72 inch.
Data Types: single | double | int8 | int16 | int32 | int64 | uint8 | uint16 | uint32 | uint64
Token character slant, specified as "normal" or
"italic".
Some fonts do not have both font styles. For these fonts, the italic slant looks the same as the normal font.
Token font size units, specified as one of the values in this table.
Units | Description |
|---|---|
"points" | Points. One point equals 1/72 inch. |
"inches" | Inches. |
"centimeters" | Centimeters. |
"normalized"
| Interpret font size as a fraction of the axes plot box height. If you
resize the axes, the font size modifies accordingly. For example, if
FontSize is 0.1 in normalized units,
then the text is 1/10 the plot box height. |
"pixels" | Pixels. On Windows and Macintosh systems, the size of a pixel is 1/96th of an inch. This size is independent of your system resolution. On Linux systems, the size of a pixel is determined by your system resolution. |
Note
If you set the font size and the font units in one function call, you must set the
FontUnits property first so that the axes correctly interprets
the specified font size.
Token character thickness, specified as "normal" or
"bold".
MATLAB® uses the FontWeight property to select a font from
those available on your system. Some fonts do not have a bold weight. For these fonts,
the bold font weight looks the same as the normal font.
Label character slant, specified as "italic" or
"normal".
Some fonts do not have both font styles. For these fonts, the italic slant looks the same as the normal font.
Label character thickness, specified as "normal" or
"bold".
MATLAB uses the FontWeight property to select a font from
those available on your system. Some fonts do not have a bold weight. For these fonts,
the bold font weight looks the same as the normal font.
Data
Position
Visibility of the object handle in the Children property of the parent, specified as one of these values:
"on"— Object handle is always visible."off"— Object handle is invisible at all times. Use this option to prevent unintended changes to the UI by another function. SetHandleVisibilityto"off"to temporarily hide the handle when you execute another function."callback"— Object handle is visible from within callbacks or functions invoked by callbacks, but not from within functions invoked from the command line. This option blocks access to the object at the command-line, but allows callback functions to access it.
If the object is not listed in the Children property of the parent, then
functions that obtain object handles by searching the object hierarchy or querying
handle properties cannot return it. These functions include get, findobj, gca, gcf, gco, newplot, cla, clf, and close.
Hidden object handles are still valid. Set the root ShowHiddenHandles
property to "on" to list all object handles regardless of their
HandleVisibility property setting.
Inner size and location, specified as a four-element vector of the form
[left bottom width height]. This property is equivalent to the
Position property.
Note
Setting this property has no effect when the parent container is a
TiledChartLayout object.
Layout options, specified as a TiledChartLayoutOptions or
GridLayoutOptions object. Use this property when the dependency
chart object is in a tiled chart layout or a grid layout.
To position the axes within the grid of a tiled chart layout, set the
Tile and TileSpan properties of the
TiledChartLayoutOptions object. For example, consider a 3-by-3
tiled chart layout. The layout has a grid of tiles in the center and four tiles along
the outer edges. In practice, the grid is invisible and the outer tiles do not take up
space until you populate them with axes or charts.
This code places the dependency chart sc in the third tile of the
grid.
sc.Layout.Tile = 3;
To make the dependency chart span multiple tiles, specify the
TileSpan property as a two-element vector. For example, this
dependency chart spans two rows and three columns of
tiles.
sc.Layout.TileSpan = [2 3];
To place the dependency chart in one of the surrounding tiles, specify the
Tile property as "north",
"south", "east", or "west".
For example, setting the value to "east" places the dependency chart
in the tile to the right of the
grid.
sc.Layout.Tile = "east";To place the dependency chart in a layout within an app, specify this property as a
GridLayoutOptions object. For more information about working with
grid layouts in apps, see uigridlayout.
If the dependency chart is not a child of a tiled chart layout or a grid layout (for example, if it is a child of a figure or panel), then this property is empty and has no effect.
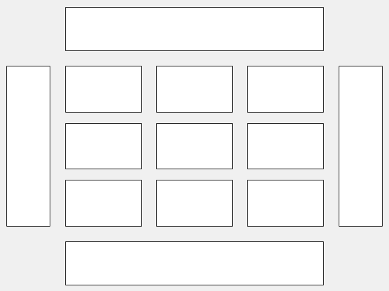
Size and location, including the labels and a margin, specified as a four-element
vector of the form [left bottom width height]. By default,
MATLAB measures the values in units that are normalized to the container. To
change the units, set the Units property. The default value of
[0 0 1 1] includes the whole interior of the container.
The
leftandbottomelements define the distance from the lower left corner of the container (typically a figure, panel, or tab) to the lower left corner of the outer position boundary.The
widthandheightelements are the outer position boundary dimensions.
This figure shows the areas defined by the OuterPosition values
(blue) and the Position values (red). By default,
InnerPosition and OuterPosition are the
same.
For more information, see Control Axes Layout.
Note
Setting this property has no effect when the parent container is a
TiledChartLayout object.
Size and location, excluding a margin for the labels, specified as a four-element
vector of the form [left bottom width height]. By default,
MATLAB measures the values in units that are normalized to the container. To
change the units, set the Units property.
The
leftandbottomelements define the distance from the lower left corner of the container (typically a figure, panel, or tab) to the lower left corner of the position boundary.The
widthandheightelements are the position boundary dimensions. For axes in a 3-D view, thePositionproperty is the smallest rectangle that encloses the axes.
This figure shows the areas defined by the OuterPosition values
(blue) and the Position values (red). By default,
InnerPosition and OuterPosition are the
same.
For more information, see Control Axes Layout.
Note
Setting this property has no effect when the parent container is a
TiledChartLayoutobject.
Position property to hold constant when adding, removing, or changing decorations, specified as one of the following values:
"outerposition"— TheOuterPositionproperty remains constant when you add, remove, or change decorations such as a title or an axis label. If any positional adjustments are needed, MATLAB adjusts theInnerPositionproperty."innerposition"— TheInnerPositionproperty remains constant when you add, remove, or change decorations such as a title or an axis label. If any positional adjustments are needed, MATLAB adjusts theOuterPositionproperty.
Note
Setting this property has no effect when the parent container is a
TiledChartLayout object.
Position units, specified as one of these values.
Units | Description |
|---|---|
"normalized" (default) | Normalized with respect to the container, which is typically the figure
or a panel. The lower left corner of the container maps to
(0,0) and the upper right corner maps to
(1,1). |
"inches" | Inches. |
"centimeters" | Centimeters. |
"characters" | Based on the default
|
"points" | Typography points. One point equals 1/72 inch. |
"pixels" | Pixels. Starting in R2015b, distances in pixels are independent of your system resolution on Windows and Macintosh systems.
|
Note
When you specify the units as name-value arguments during object creation, you
must set the Units property before specifying the properties that
you want to use these units, such as Position.
State of visibility, specified as one of these values:
"on"— Display the object."off"— Hide the object without deleting it. You still can access the properties of an invisible object.
Parent/Child
Version History
Introduced in R2022b