Results for
Big congratulations to @VBBV for achieving the remarkable milestone of 3,000 reputation points, earning the prestigious title of Editor within our community.
This achievement is a testament to @VBBV's exceptional contributions and steadfast commitment to the community. These efforts have also been endorsed by fellow top contributors, underscoring the value and impact of @VBBV's expertise.
Welcome to the Editors' Club, @VBBV – we are excited to witness and support your continued journey and influence within our community!
eye(3) - diag(ones(1,3))
11%
0 ./ ones(3)
9%
cos(repmat(pi/2, [3,3]))
16%
zeros(3)
20%
A(3, 3) = 0
32%
mtimes([1;1;0], [0,0,0])
12%
3009 votes
Hi All,
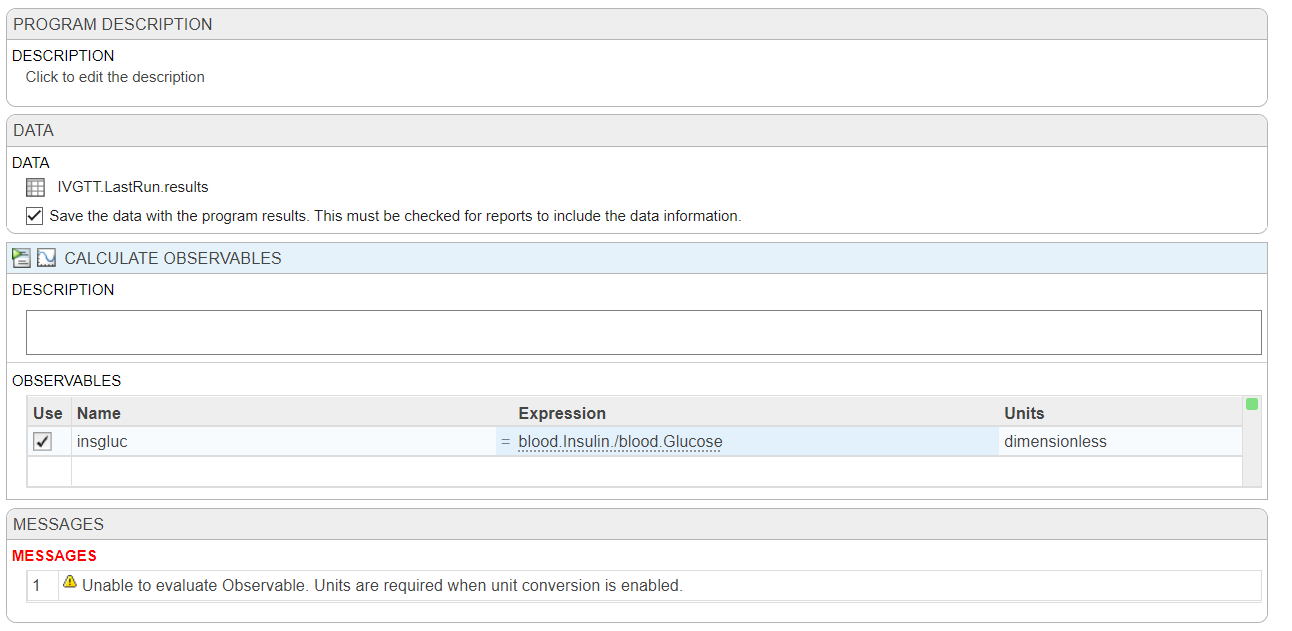
I'm trying to plot my observables in the analyzer and running into far more problems than expected. I have two species in my model that are invovled, blood.Insulin (pM) and blood.Glucose (mM), all I want to do is plot the ratio of these two (blood.Insulin/blood.Glucose (dimensionless)) along with my other species in Model Simulation, to compare it to the same ratio from my data.
First, there doesn't seem to be a way to directly add an observable to the logged states in 'Simulate Model', so I've tried to used 'Calculate Observable' based on the data from my last run (IVGTT.LastRun.results) but it says that units are required when unit conversion is enabled, but it should be dimensionless!
My next idea would be to make a non-constant parameter with a repeated assignment, but I feel like I should be able to do this without resorting to that?
Any help or ideas would be appreciated. Thank you, best regards,
Dan
I based my model construction on this PBPK model: PBPK by Armin Sepp. While this is a very convenient script for building a PBPK two-pore model, it's very incovenient for my application to have the species Units defined in molarity. Is there a convenient way to organically switch this model from molarity to grams (or any weight unit)?
We are excited to unveil the ‘Open in MATLAB Online from File Exchange’ feature, which offers MATLAB users a new way to open File Exchange content!
Previously, to experiment with File Exchange code, you were required to download the file and execute it in MATLAB. But now, there's a quicker and easier way to explore the code!
You will find the ‘Open in MATLAB Online’ button next to the ‘Download’ button (see the screenshot below). A simple click transports you directly into the MATLAB Online workflow. It's that straightforward and effortless.
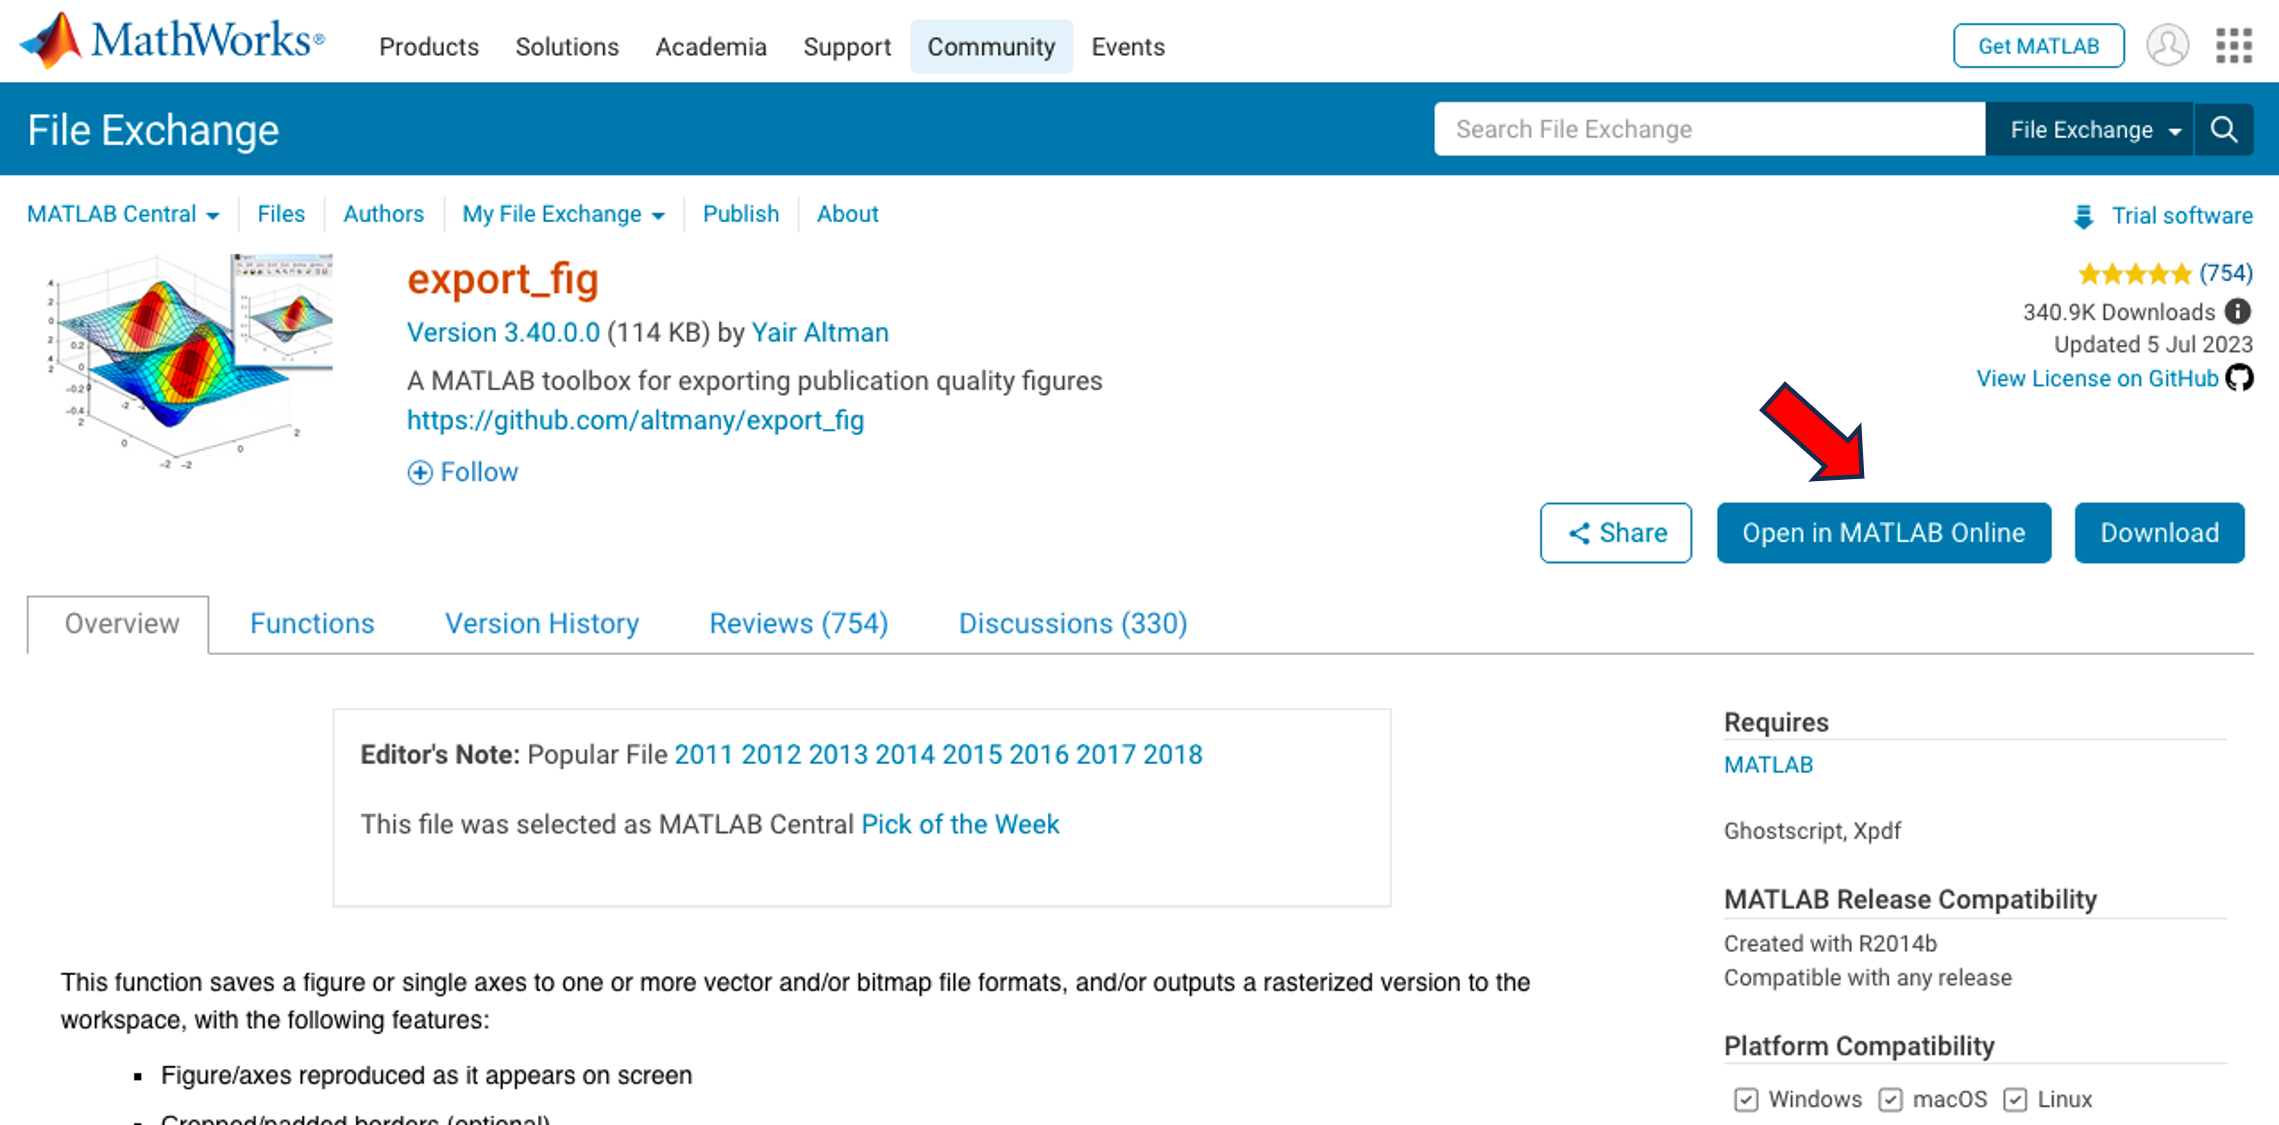
We strongly encourage you to try this new feature. Please share your questions, comments, or ideas by responding to this post!
Hello, Community Members!
Every day, we witness the incredible exchange of knowledge as over 100,000 users visit our community for answers or to get some code. We have such a vibrant community because of the dedicated group of contributors who volunteer their time and expertise to help one another.
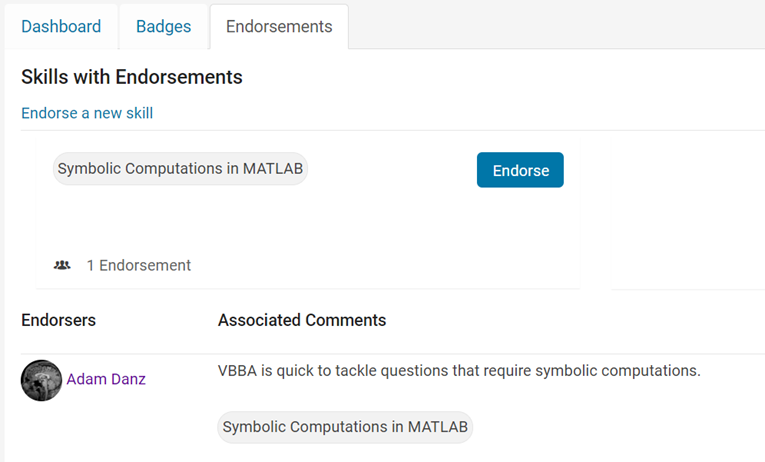
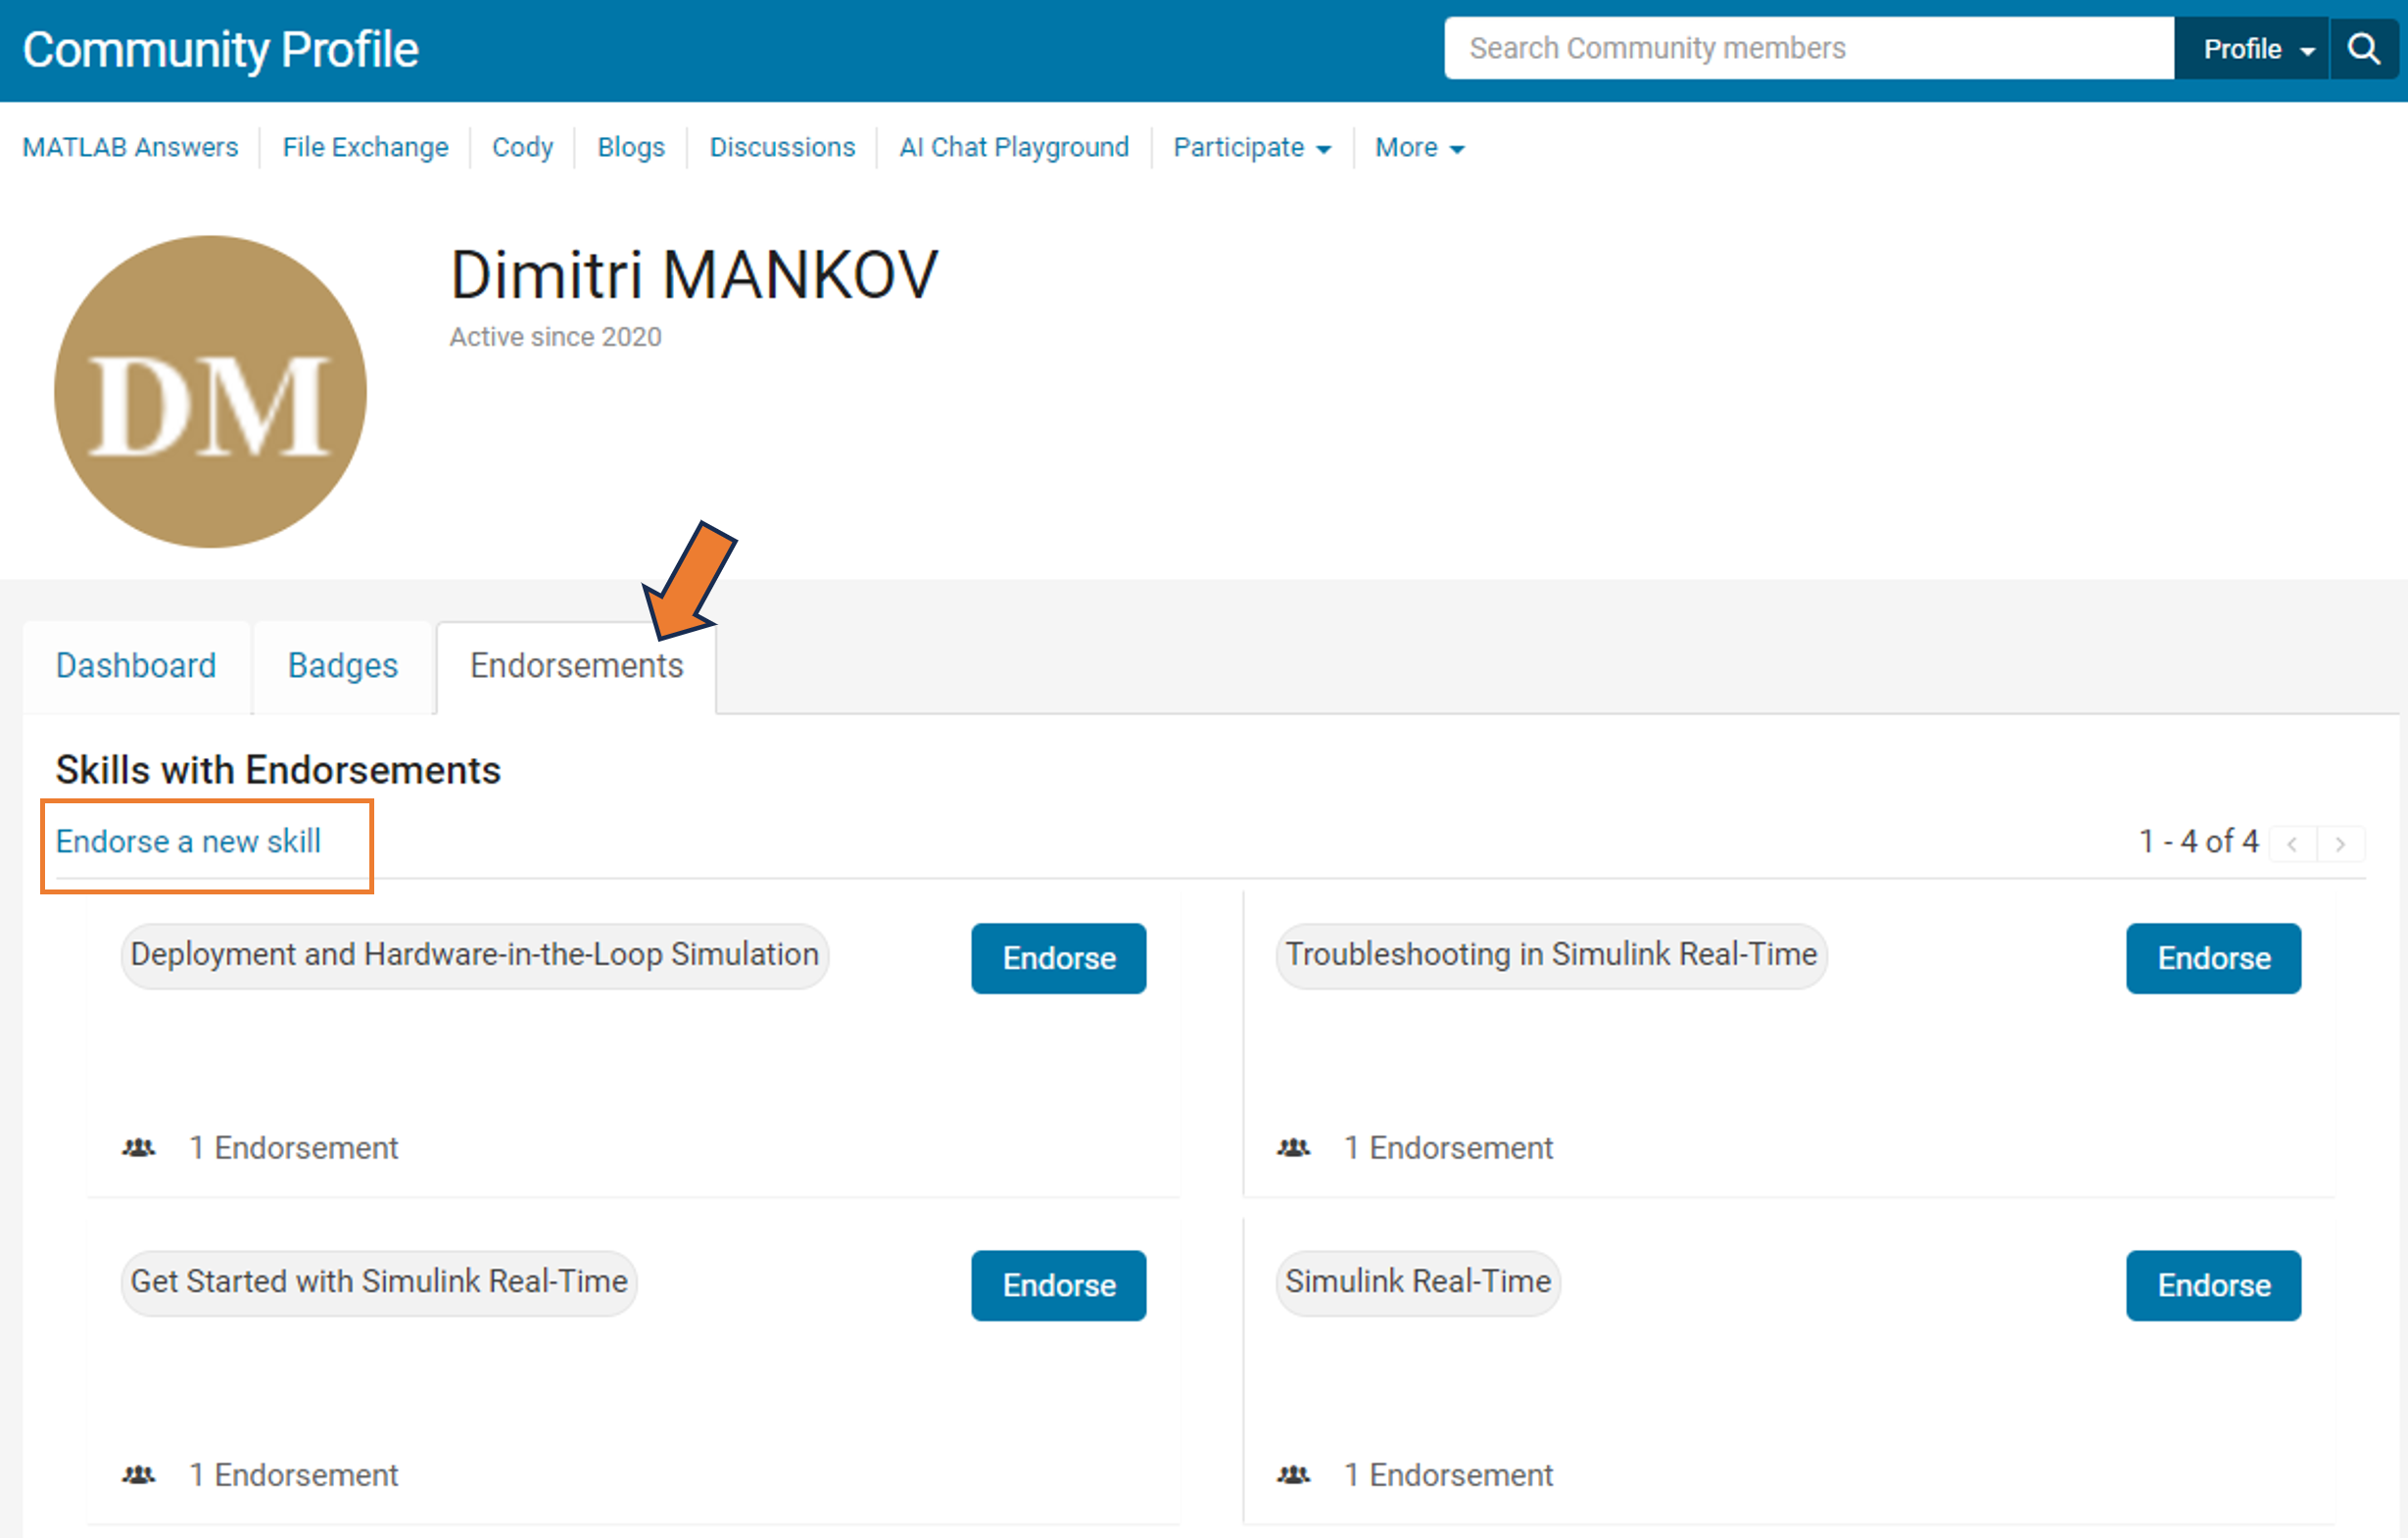
We learned that many community users are looking for different ways to show their appreciation to contributors. In response, we're thrilled to announce the launch of our latest feature – Skill Endorsements.
When you visit a contributor's profile page, you'll notice a brand-new 'Endorsements' tab. Here, you have the power to acknowledge the skills of your fellow members by either endorsing a new skill or bolstering existing ones.
But it's more than just saying "thank you." By highlighting the strengths of our members, you're contributing to an environment of trust and making it easier for users to connect with experts in specific areas.
So, take a moment to reflect: Who has made a difference in your community experience? Whose expertise has guided you through a challenge? Show your appreciation and support their contributions – start endorsing skills today!
Your participation makes all the difference.
Warm regards,
MATLAB Central Community Team
Hi! I'm new to pk modeling and Matlab. Can someone guide me through how to conduct population pk modeling based on pk parameters from non-human primate studies? Much thanks!!!!
American style football
12%
Soccer / football
39%
baseball
5%
basketball
12%
tennis or golf
7%
rugby, track, cricket, racing, etc.
26%
3712 votes
You reached this milestone by providing valuable contribution to the community since you started answering questions in Since September 2018.
You provided 3984 answers and received 1142 votes. You are ranked #24 in the community. Thank you for your contribution to the community and please keep up the good track record!
MATLAB Central Team
The MATLAB AI Chat Playground is now open to the whole community! Answer questions, write first draft MATLAB code, and generate examples of common functions with natural language.
The playground features a chat panel next to a lightweight MATLAB code editor. Use the chat panel to enter natural language prompts to return explanations and code. You can keep chatting with the AI to refine the results or make changes to the output.

Give it a try, provide feedback on the output, and check back often as we make improvements to the model and overall experience.
What amazing animations can be created with no more than 2000 characters of MATLAB code? Check out our GALLERY from the MATLAB Flipbook Mini Hack contest.
Vote on your favorite animations before Dec. 3rd. We will give out MATLAB T-shirts to 10 lucky voters!


Tips: the more you vote, the higher your chance to win.
The title is resonably non-descript, but I can explain it easily:
Say I have an initial Emax model:
v = emax1*[G]^n1/(ec501^n1+[G]^n1)
And I want to place v inside of a second Emax model:
y = emax2*v^n2/(ex502^n2+v^n2)
Currently, I have the full function of v inside y, twice, it's very long and whilst I only need to get it correct once, for readability in the future I'd rather have it in form #2. I've played around with non-constant parameters but I need the steady state to be v, not the rate rule, and I haven't worked out how to make a parameter shift to a form like v, as an observation might.
Are there any recommended solutions or do I simply need to keep with having v fully expressed in y?
Thank you,
Dan
You are invited to join our 2023 community contest – MATLAB Flipbook Mini Hack! This year’s contest revolves around creating interesting animations using MATLAB.
Whether you are a seasoned MATLAB user or just getting started, this contest offers a fantastic opportunity to showcase your skills, learn from others, and engage with the vibrant MATLAB Central community.
Timeframe
This contest runs for 4 weeks from Nov. 6th to Dec. 3rd.
How to play
- Create a new animation or remix an existing one with up to 2,000 characters of code.
- Simply vote on the animations you love!
Prizes
You will have opportunities to win compelling prizes, including Amazon gift cards, MathWorks T-shirts, and virtual badges. We will give out both weekly prizes and grand prizes.


The MATLAB Central Community team
Hi All,
I'm currently attempting to implement a Hodgkin-Huxley-type model of membrane potential, ideally I would like a species that represents the membrane potential as its own distinct entity, so as the reference elsewhere. I've currently established a molarity-based work around but it would be great if I could set the units for the species as millivolt, but that throws an error.
Is there an established way to do this? I imagine I'm not the first person to be trying to model a voltage-gated ion channel!
Thank you for your help.
Hello,
I've looked around and I haven't found anything obvious about this, but is it possible to link to species/reactions, graphically, in a non-mass transfer sense? I have areas in my model where it would conceptually make sense to be able to see that species or reactions are linked, but if I link them in the standard way it demands that it be involved in the stoichiometry.
Perhaps some kind of dotted line, or similar?
Thank you, best regards,
Dan
I rarely/never save .fig files
47%
Continue working on it later
16%
Archive for future reference
23%
Share within my organization
10%
Share outside my organization
2%
Other (please leave a comment)
2%
2097 votes
Adam and Heather will be discussing new features in R2023b and answering your questions in a few hours - visit the link below to check out the preview and sign up for notification.
Hello all,
I've been trying to shift my workflow more towards simbiology, it has a lot of very interesting features and it makes sense to try and do everything in one place if it works well..! Part of my hesitancy into this was some bad experiences handling units in the past, though this was almost certainly all out of my own ignorance, relatedly:
Getting onto my question.
In this model I have a species traveling around the body via blow flow, think a basic PBPK model. My species are picomolarities, if everything is already in concentrations, why is it necessary to initially divide by the compartment volume? i.e. 1/Pancreas below.

If my model dealt in molar quantities this would make a lot of sense, the division would represent the transition to concentrations. This, however, now necessitates my parameters be in units of liter/minute, which is actually correct, but I'd like clarification on why it's correct, ha!
Perhaps this is more of a modelling question than a simbiology question, but if there are answers I'd love to hear them. Thanks!
Adam Danz just launched a new blog about MATLAB Graphics and App Building.
As you know, He has been a prolific contributor to MATLAB Answers and one of his answers recently won the Editor's Choice Award.
If there are any topics or questions you are interested in, please share with Adam, and I am sure he will get those into his blog.
4 months ago, the new API was published to access content on the MATLAB Central community. I shared my MATLAB code to access the API at that time, but the team just released the official SDK.
MATLAB toolbox on File Exchange: https://www.mathworks.com/matlabcentral/fileexchange/135567-matlab-central-interface-for-matlab