Lunar Mission Analysis with the Orbit Propagator Block
This example shows how to compute and visualize access intervals between the Apollo Command and Service module and a rover on the lunar surface. The module's orbit is modeled using Reference Trajectory #2 from the NASA report Variations of the Lunar Orbital Parameters of the Apollo CSM-Module [2]. This is a lunar orbit studied by NASA for the Apollo program. The example uses:
Aerospace Toolbox
Aerospace Blockset™
Mapping Toolbox™
Define Mission Parameters and Module Initial Conditions
Specify the start date and duration for the mission. This example uses MATLAB® structures to organize mission data. These structures make accessing data later in the example more intuitive. They also help declutter the global base workspace.
mission.StartDate = datetime(1969, 9, 20, 5, 10, 12.176);
mission.Duration  = hours(2);
Specify Keplerian orbital elements for the Command and Service module (CSM) at the mission.StartDate based on Reference Trajectory #2 [2]. The criteria for the reference trajectories featured in Reference 2 are:
The plane of the trajectory must contain a landing site vector on the Earth side of the Moon, which has a longitude of between 315 and 45 degrees and a latitude of between +5 and -5 degrees in selenographic coordinates. [2]
The plane of the orbit must be oriented so that the lunar landing side doesn't move out of the orbital plane more than 0.5 degrees during the period of 3 to 39 hours after lunar insertion. [2]
csm.SemiMajorAxis  = 1894578.3;     % [m]
csm.Eccentricity   = 0.0004197061;
csm.Inclination    = 155.804726;    % [deg]
csm.RAAN           = 182.414087;    % [deg]
csm.ArgOfPeriapsis = 262.877900;    % [deg]
csm.TrueAnomaly    = 0.000824;      % [deg]
Note that the inclination angle is relative to the ICRF X-Y plane. The ICRF X-Y axis is normal to Earth's north pole. The axial tilt of Earth relative to the ecliptic is ~23.44 degrees, while the axial tilt of the Moon is ~5.145 degrees. Therefore, the axial tilt of the Moon relative to the ICRF X-Y plane varies between approximately degrees. This explains why the orbital inclination of ~155.8 degrees above satisfies the requirement to maintain a latitude of degrees in selenographic coordindates.
Specify the latitude and longitude of a rover on the lunar surface to use in the line-of-sight access analysis.
rover.Latitude =0; % [deg] rover.Longitude =
23.5; % [deg]
Open and Configure the Model
Open the included Simulink® model. This model contains an Orbit Propagator block connected to output ports. The Orbit Propagator block supports vectorization. This allows you to model multiple satellites in a single block by specifying arrays of initial conditions in the Block Parameters window or using set_param.

mission.mdl = "LunarOrbitPropagatorBlockExampleModel";
open_system(mission.mdl);
Use a SimulationInput object to configure the model for our mission. SimulationInput objects provide the ability to configure multiple missions and run simulations with those settings without modifying the model.
mission.sim.in = Simulink.SimulationInput(mission.mdl);
Define the path to the Orbit Propagator block in the model.
csm.blk = mission.mdl + "/Orbit Propagator";Load Moon properties into the base workspace.
moon.F = 0.0012;  % Moon ellipticity (flattening) (Ref 1)
moon.R_eq = 1737400; % [m] Lunar radius in meters (Ref 1)
moon.ReferenceEllipsoid = referenceEllipsoid("moon","meter"); % Moon reference ellipsoid
moon.Data = matfile("lunarGeographicalData.mat"); % Load moon geographical data
Set CSM initial conditions. To assign the Keplerian orbital element set defined in the previous section, use setBlockParameter.
mission.sim.in = mission.sim.in.setBlockParameter(...
    csm.blk, "startDate", string(juliandate(mission.StartDate)),...
    csm.blk, "stateFormatNum", "Orbital elements",...
    csm.blk, "orbitType", "Keplerian",...
    csm.blk, "semiMajorAxis", string(csm.SemiMajorAxis),...
    csm.blk, "eccentricity", string(csm.Eccentricity),...
    csm.blk, "inclination", string(csm.Inclination),...
    csm.blk, "raan", string(csm.RAAN),...
    csm.blk, "argPeriapsis", string(csm.ArgOfPeriapsis),...
    csm.blk, "trueAnomaly", string(csm.TrueAnomaly));
Set the position and velocity output ports of the block to use the Moon-fixed frame. The fixed-frame for the Moon is the Mean Earth/Pole Axis (ME) reference system.
mission.sim.in = mission.sim.in.setBlockParameter(...
    csm.blk, "centralBody", "Moon",...
    csm.blk, "outportFrame", "Fixed-frame");
Configure the propagator.
mission.sim.in = mission.sim.in.setBlockParameter(...
    csm.blk, "propagator", "Numerical (high precision)",...
    csm.blk, "gravityModel", "Spherical Harmonics",...
    csm.blk, "moonSH", "LP-100K",... % moon spherical harmonic potential model
    csm.blk, "shDegree", "100",... % Spherical harmonic model degree and order
    csm.blk, "useMoonLib", "off");
Apply model-level solver settings using setModelParameter. For best performance and accuracy when using a numerical propagator, use a variable-step solver.
mission.sim.in = mission.sim.in.setModelParameter(...
    SolverType="Variable-step",...
    SolverName="VariableStepAuto",...
    RelTol="1e-6",...
    AbsTol="1e-7",...
    StopTime=string(seconds(mission.Duration)));
Save model output port data as a dataset of timetable objects.
mission.sim.in = mission.sim.in.setModelParameter(...
    SaveOutput="on",...
    OutputSaveName="yout",...
    SaveFormat="Dataset",...
    DatasetSignalFormat="timetable");
Run the Model and Collect CSM Ephemerides
Simulate the model using the SimulationInput object defined above. In this example, the Orbit Propagator block is set to output position and velocity states in the Moon-centered fixed coordinate frame.
mission.sim.out = sim(mission.sim.in);
Extract the position and velocity data from the model output data structure.
csm.TimetablePos = mission.sim.out.yout{1}.Values;
csm.TimetableVel = mission.sim.out.yout{2}.Values;
Set the start date of the mission in the timetable object.
csm.TimetablePos.Properties.StartTime = mission.StartDate;
Process Simulation Data
Compute latitude, longitude, and altitude using lunar equatorial radius and flattening. Values are displayed in degrees and meters.
csm.MEPos = [csm.TimetablePos.Data(:,1) ...
    csm.TimetablePos.Data(:,2) csm.TimetablePos.Data(:,3)];
lla = ecef2lla(csm.MEPos, moon.F, moon.R_eq);
csm.LLA = timetable(csm.TimetablePos.Time, ...
    lla(:,1), lla(:,2), lla(:,3), ...
    VariableNames=["Lat", "Lon", "Alt"]);
clear lla;
disp(csm.LLA);
            Time               Lat         Lon         Alt
    ____________________    _________    _______    __________

    20-Sep-1969 05:10:12      -2.3072     175.32    1.5639e+05
    20-Sep-1969 05:10:22      -2.3039     174.83    1.5639e+05
    20-Sep-1969 05:11:12      -2.2846     172.39    1.5639e+05
    20-Sep-1969 05:13:36      -2.2061     165.35    1.5639e+05
    20-Sep-1969 05:16:00      -2.0947     158.31     1.564e+05
    20-Sep-1969 05:18:24       -1.952     151.27    1.5641e+05
    20-Sep-1969 05:20:48      -1.7804     144.24    1.5641e+05
    20-Sep-1969 05:23:12      -1.5824     137.21    1.5642e+05
    20-Sep-1969 05:25:36      -1.3608     130.17    1.5641e+05
    20-Sep-1969 05:28:00       -1.119     123.14    1.5641e+05
    20-Sep-1969 05:30:24     -0.86057     116.11     1.564e+05
    20-Sep-1969 05:32:48     -0.58934     109.09     1.564e+05
    20-Sep-1969 05:35:12     -0.30942     102.06    1.5639e+05
    20-Sep-1969 05:37:36    -0.025001     95.032    1.5639e+05
    20-Sep-1969 05:40:00      0.25967     88.006     1.564e+05
    20-Sep-1969 05:42:24      0.54034     80.978     1.564e+05
    20-Sep-1969 05:44:48      0.81284     73.951    1.5641e+05
    20-Sep-1969 05:47:12       1.0732     66.923    1.5642e+05
    20-Sep-1969 05:49:36       1.3175     59.893    1.5643e+05
    20-Sep-1969 05:52:00       1.5422     52.863    1.5646e+05
    20-Sep-1969 05:54:24       1.7439     45.831    1.5649e+05
    20-Sep-1969 05:56:48       1.9194     38.797    1.5652e+05
    20-Sep-1969 05:59:12       2.0662     31.763    1.5656e+05
    20-Sep-1969 06:01:36       2.1821     24.728     1.566e+05
    20-Sep-1969 06:04:00       2.2652     17.691    1.5664e+05
    20-Sep-1969 06:06:24       2.3145     10.655    1.5668e+05
    20-Sep-1969 06:08:48       2.3291     3.6183    1.5673e+05
    20-Sep-1969 06:11:12        2.309     -3.418    1.5676e+05
    20-Sep-1969 06:13:36       2.2544    -10.454    1.5679e+05
    20-Sep-1969 06:16:00       2.1663    -17.489    1.5682e+05
    20-Sep-1969 06:18:24        2.046    -24.522    1.5683e+05
    20-Sep-1969 06:20:48       1.8953    -31.554    1.5685e+05
    20-Sep-1969 06:23:12       1.7163    -38.585    1.5686e+05
    20-Sep-1969 06:25:36       1.5116    -45.614    1.5686e+05
    20-Sep-1969 06:28:00       1.2844    -52.642    1.5686e+05
    20-Sep-1969 06:30:24       1.0381    -59.668    1.5686e+05
    20-Sep-1969 06:32:48      0.77625    -66.693    1.5685e+05
    20-Sep-1969 06:35:12      0.50273    -73.718    1.5684e+05
    20-Sep-1969 06:37:36      0.22159    -80.741    1.5683e+05
    20-Sep-1969 06:40:00    -0.062926    -87.765    1.5682e+05
    20-Sep-1969 06:42:24     -0.34651    -94.789     1.568e+05
    20-Sep-1969 06:44:48     -0.62489    -101.81    1.5677e+05
    20-Sep-1969 06:47:12     -0.89393    -108.84    1.5673e+05
    20-Sep-1969 06:49:36      -1.1497    -115.87    1.5669e+05
    20-Sep-1969 06:52:00      -1.3884    -122.89    1.5664e+05
    20-Sep-1969 06:54:24      -1.6064    -129.92     1.566e+05
    20-Sep-1969 06:56:48      -1.8006    -136.96    1.5656e+05
    20-Sep-1969 06:59:12      -1.9679    -143.99    1.5652e+05
    20-Sep-1969 07:01:36      -2.1058    -151.03    1.5647e+05
    20-Sep-1969 07:04:00       -2.212    -158.06    1.5641e+05
    20-Sep-1969 07:06:24      -2.2849     -165.1    1.5635e+05
    20-Sep-1969 07:08:48      -2.3235    -172.14     1.563e+05
    20-Sep-1969 07:10:12      -2.3299    -176.25    1.5626e+05
Results
Display CSM Trajectories over the 3-D Moon
figure; axis off; colormap gray; view(-5,23);
axesm("globe","Geoid", moon.ReferenceEllipsoid);
geoshow(moon.Data.moonalb20c, moon.Data.moonalb20cR, DisplayType="texturemap");
plot3(csm.MEPos(:,1), csm.MEPos(:,2), csm.MEPos(:,3),"r");

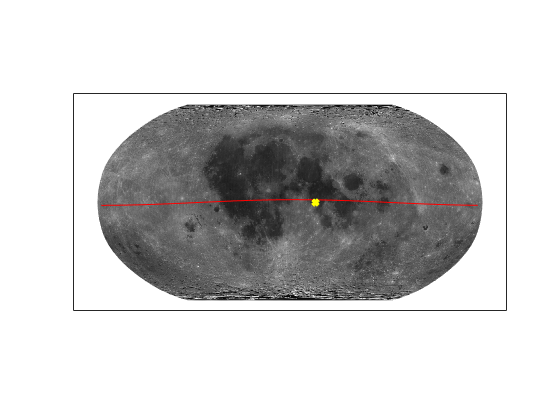
Display 2-D Projection of CSM Ground Trace and Rover Position
figure; colormap gray;
axesm(MapProjection="robinson");
geoshow(moon.Data.moonalb20c, moon.Data.moonalb20cR, DisplayType="texturemap");
plotm(csm.LLA.Lat, csm.LLA.Lon, Color="r");
plotm(rover.Latitude, rover.Longitude, "xy", LineWidth=3);
Display CSM Field of View at Time of Interest
Define a time of interest (TOI) to analyze. For this example, we select the 30th sample in the dataset.
csm.TOI.LLA = csm.LLA(30,:);
Calculate angular radius of orbiter line-of-sight (LOS) field of view (FOV) measured from the Moon center.
csm.TOI.FOV.Lambda0 = acosd(moon.R_eq / (moon.R_eq + csm.TOI.LLA.Alt)); % [deg]
[csm.TOI.FOV.Lats, csm.TOI.FOV.Lons] = ...
    scircle1(csm.TOI.LLA.Lat, csm.TOI.LLA.Lon, csm.TOI.FOV.Lambda0);
Plot TOI. The location of the CSM is indicated by a green cross, LOS field of view is indicated by dashed circle.
figure; colormap gray;
axesm(MapProjection="robinson");
geoshow(moon.Data.moonalb20c, moon.Data.moonalb20cR, DisplayType="texturemap");
plotm(csm.TOI.FOV.Lats, csm.TOI.FOV.Lons, "g--", LineWidth=1); % CSM visibility projected onto the map
plotm(csm.LLA.Lat, csm.LLA.Lon, Color="r");                    % CSM ground trace
plotm(csm.TOI.LLA.Lat, csm.TOI.LLA.Lon, "g+", MarkerSize=8);   % sub-CSM point
plotm(rover.Latitude, rover.Longitude, "xy", LineWidth=3);

Display CSM Line-of-Sight Visibility from Rover
Estimate access intervals by assuming the Moon is spherical.
lambda_all  = acosd(moon.R_eq ./ (moon.R_eq + csm.LLA.Alt)); % [deg] angular radius of CSM FOV measured from Moon center
d = distance(csm.LLA.Lat, csm.LLA.Lon, ...
    rover.Latitude, rover.Longitude);                        % [deg] angular distance between sub-CSM point and rover
rover.Access.InView = csm.LLA(lambda_all - d > 0,:);         % timetable containing the in view data samples
rover.Access.InView.Time.Format = "HH:mm:ss";
clear lambda_all d;
Plot access intervals between the orbiting module and rover.
if height(rover.Access.InView) ~= 0
    % Look for breaks in the timestamps to identify pass starts
    rover.Access.StartIdx = [1, find(diff(rover.Access.InView.Time) > minutes(5))];
    rover.Access.StartTime = rover.Access.InView.Time(rover.Access.StartIdx);
    rover.Access.StopIdx = [rover.Access.StartIdx(2:end)-1, height(rover.Access.InView)];
    rover.Access.StopTime = rover.Access.InView.Time(rover.Access.StopIdx);
    rover.Access.Duration = rover.Access.StopTime - rover.Access.StartTime;
    % Show pass intervals in table
    rover.Access.IntervalTable = table(rover.Access.StartTime, rover.Access.StopTime, rover.Access.Duration, ...
        VariableNames=["Pass Start", "Pass End", "Duration"]);
    disp(rover.Access.IntervalTable);
    disp(' ');
    % Set up figure window/plot
    figure; colormap gray;
    axesm(MapProjection="robinson")
    geoshow(moon.Data.moonalb20c, moon.Data.moonalb20cR, DisplayType="texturemap")
    title(join(["Passes Between", string(csm.LLA.Time(1)), ...
        "and", string(csm.LLA.Time(end))]));
    % Plot inView, rover, and CSM orbit
    plotm(rover.Access.InView.Lat, rover.Access.InView.Lon, "+g");
    plotm(rover.Latitude, rover.Longitude, "xy", LineWidth=3);
    plotm(csm.LLA.Lat, csm.LLA.Lon, Color="r");
    % Plot pass inteval
    rover.Access.EdgeIndices = rover.Access.InView(sort([rover.Access.StartIdx rover.Access.StopIdx]), :);
    for j = 1 : height(rover.Access.EdgeIndices)
        textm(rover.Access.EdgeIndices.Lat(j) + 10, ...
            rover.Access.EdgeIndices.Lon(j), ...
            string(rover.Access.EdgeIndices.Time(j)), Color="y", Rotation=30);
    end
else
    disp("The CSM is not visible from the rover during the defined mission time.")
end
    Pass Start    Pass End    Duration
    __________    ________    ________

     05:54:24     06:08:48    00:14:24

References
[1] Williams, Dr. David R. “Moon Fact Sheet”, Planetary Fact Sheets, NSSDCA, NASA Goddard Space Flight Center, 13 January 2020, https://nssdc.gsfc.nasa.gov/planetary/factsheet/moonfact.html.
[2] Timer, T.P. (NASA Mission Analysis Office) "Variations of the Lunar Orbital Parameters of the Apollo CSM-Module", NASA TM X-55460. Greenbelt, Maryland: Goddard Space Flight Center, February 1966.