visualize
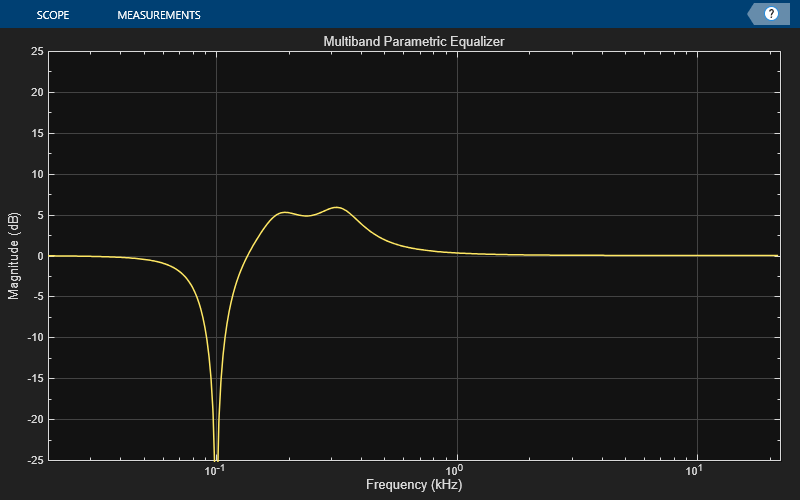
Visualize magnitude response of multiband parametric equalizer
Description
visualize( plots the magnitude
response of the mPEQ)multibandParametricEQ object
mPEQ. The plot is updated automatically when properties of
the object change.
hvsz = visualize(___)dsp.DynamicFilterVisualizer object when called with any of the
previous syntaxes.
Examples
Input Arguments
Version History
Introduced in R2016a
