Wireless Channel Designer
Description
The Wireless Channel Designer app enables you to design and analyze wireless channels.
Using the app, you can:
Configure MIMO fading channel parameters. Each MIMO channel model parameter in the app corresponds to a
comm.MIMOChannelSystem object™ property.Visualize the configured MIMO channel impulse response, frequency response, and Doppler spectrum.
Design and analyze a 5G tapped delay line (TDL) channel. This feature requires 5G Toolbox™. For more information, see Wireless Channel Designer (5G Toolbox).
Export a channel configuration and the path gains to workspace variables or a
.matfile.Export a channel configuration to an executable MATLAB® script. Use the script to programmatically generate the path gains and pass a waveform through the channel.
Open the Wireless Channel Designer App
MATLAB Toolstrip: On the Apps tab, under Wireless
Communications, click the Wireless Channel Designer app icon: ![]() .
.
MATLAB Command Prompt: Enter wirelessChannelDesigner.
Examples
Create a MIMO fading channel using the Wireless Channel Designer app.
On the Apps tab of the MATLAB toolstrip, under Signal Processing and Communication, click the Wireless Channel Designer app icon.
In the Channel Type section on the app toolstrip, click
the  button to configure the app for a MIMO fading channel.
Design a MIMO fading channel by using the parameters displayed in the app. Each of
these parameters corresponds to a property of the comm.MIMOChannel
System object.
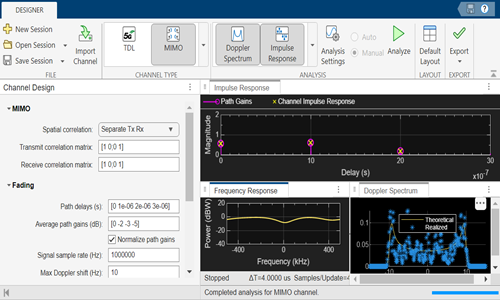
You can select one or all visualization scopes and change the analysis parameters in the Analysis section.
When you click Analyze, the app displays the results using the specified scopes.
Doppler Spectrum — Plots both the theoretical and the empirical Doppler spectrum for the path indicated by the Path for display configuration from Analysis Settings. In the Analysis Settings, the Transmit antenna (index) and Receive antenna (index) specify the path gains of the links used to plot the Doppler spectrum.
Impulse Response — Plots the time-varying path gains and channel coefficients. In the Analysis Settings, the Transmit antenna (index) and Receive antenna (index) specify the links.
Frequency Response — Plots the channel time-varying frequency response. In the Analysis Settings, the Transmit antenna (index) and Receive antenna (index) specify the path gains of the links used to plot the frequency response.
Import a MIMO fading channel created using comm.MIMOChannel
System object and analyze the channel.
Create a MIMO channel object using name-value pairs to set the properties. The
channel has two paths, each with a maximum Doppler shift of 5 Hz. Set the
SpatialCorrelationSpecification property to
'None', which requires that you specify the number of transmit and
receive antennas. Specify four transmit antennas and two receive antennas.
mimochannel = comm.MIMOChannel( ...
    SampleRate=1000, ...
    PathDelays=[0 2e-3], ...
    AveragePathGains=[0 -5], ...
    MaximumDopplerShift=5, ...
    SpatialCorrelationSpecification='None', ...
    NumTransmitAntennas=4, ...
    NumReceiveAntennas=2);
In the Wireless Channel Designer Toolstrip, use the Import
Channel button in the app toolstrip to import the MIMO fading channel,
mimochannel, from the MATLAB workspace. The values of the parameters in Channel
Design match the values of mimochannel.
In the Visual Analysis tab of the Analysis section, clear Doppler Spectrum and Frequency Response. Click the Analyze button to visualize the channel impulse response.
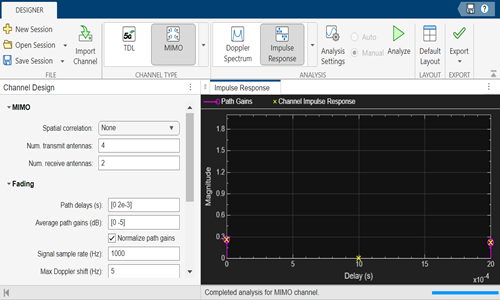
The impulse response plot of the MIMO channel shows the effects of multipath propagation, with distinct peaks for each path delay and varying amplitudes based on path gains.
Path Delays
The channel model specifies two path delays: 0 seconds and 2 milliseconds.
The 0-second delay simulates the direct path from the transmitter to the receiver.
The 2-millisecond delay simulates a reflected or scattered path.
Path Gains
The impulse response shows two peaks: 0 seconds with a 0 dB gain and 2 milliseconds with a —5 dB gain.
The direct path peak is higher, indicating stronger signal strength than the attenuated delayed path.
Delay Spread
The delay spread is the time difference between the earliest (0 seconds) and latest (2 milliseconds) arriving paths, measured as 2 milliseconds.
This impulse response plot shows a delay spread of 2 milliseconds between the peaks.
Using the Wireless Channel Designer app, create a frequency-selective 2-by-2 MIMO channel and then analyze its frequency response.
In Channel Design, set the following values:
Num. transmit antennas = 2
Num. receive antennas = 2
Signal sample rate (Hz) = 10 MHz
Max Doppler shift (Hz) = 70 Hz
Path delays (s) = [0 30 150 310 370 710 1090 1730 2510]*1e-9
Average path gains (dB) = [0 -1.5 -1.4 -3.6 -0.6 -9.1 -7 -12 -16.9]
Click Analysis Settings in the Analysis section to set the following values:
Transmit antenna (index) = 2
Receive antenna (index) = 2
Duration (s) = 4
Based on the settings, the analysis runs for 4 seconds and shows the frequency response plot between the second transmit antenna and the second receive antenna.
In the Visual Analysis tab of the Analysis section, clear Doppler Spectrum and Impulse Response.
Click the Analyze button to visualize the frequency response of the channel.
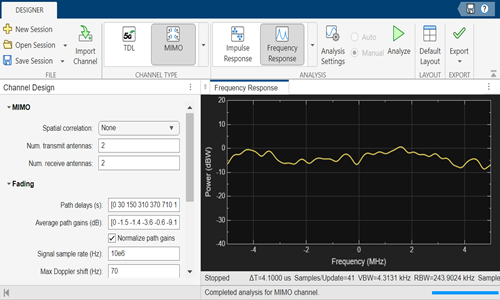
The frequency response shows the effect of the channel on different frequency components of the signal.
Multipath Effects
The frequency response illustrates how the channel impacts different frequency components due to multipath interference.
Constructive and destructive interference occurs when the received signal is a superposition of all multipath components, each contributing based on its path gain. Paths with higher (less negative) gains, like —0.6 dB, have a stronger influence than those with lower gains, such as —16.9 dB.
Path Delays and Phase Shifts
Interference patterns occurs when path delays introduce phase shifts that vary with frequency, causing frequency-selective fading characterized by ripples in the frequency response.
Coherence bandwidth is inversely related to the delay spread. Larger delay spreads result in smaller coherence bandwidths, leading to rapid changes in the frequency response.
Doppler Effects
A 70 Hz maximum Doppler shift causes the frequency response to vary over time, leading to frequency spreading.
Time variability occurs when the Doppler shift results in a short coherence time, causing the channel's frequency response to change quickly.
Version History
Introduced in R2025a