Debug Deep Learning Experiments
In Experiment Manager, you use MATLAB® functions to configure the training data, network architecture, and training options, specify the training procedure, and evaluate the results of your deep learning experiment. You can diagnose problems in these functions by stepping through your code line-by-line and examining the values of your variables.
Start Debugging Session
You can debug your code before or after you run the experiment.
To debug your code before you run the experiment:
Open the experiment.
In the Experiment Manager toolstrip, select Run > Debug
 .
.In dialog box, specify the hyperparameter values for your experiment.
Click Start.
To debug your code after you run the experiment:
Open the results for the experiment.
In the results table, select a trial to debug. To ensure reproducibility, Experiment Manager reuses the hyperparameter values and the random seed saved for this trial.
Right-click the trial and select Debug
 .
.
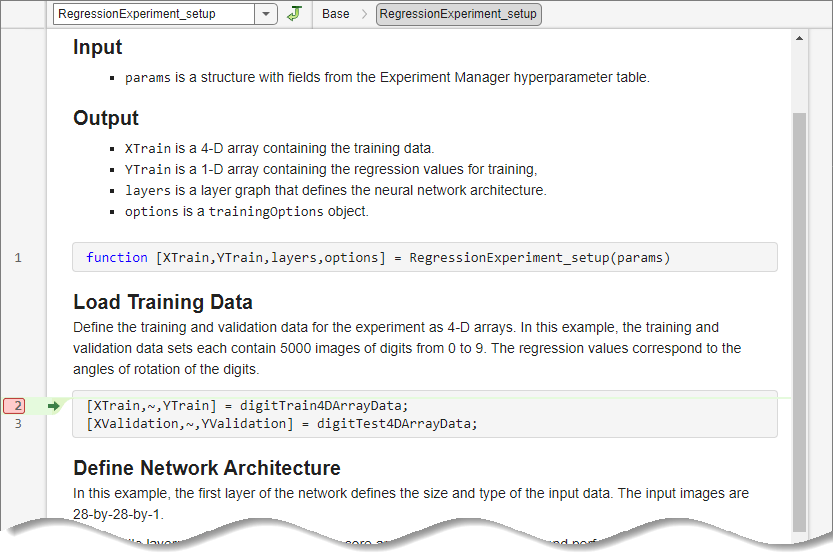
Experiment Manager opens the setup or training function in MATLAB Editor, places a breakpoint in the first line of code, and runs the function.

Verify Your Results
After your function runs to completion, verify your results by examining the hyperparameters and output values stored in the workspace variables
functionName_paramsfunctionName_output
where functionName is the name of the setup or
training function.
Debug Metric Functions
After you debug the setup function for a built-in training experiment, you can inspect
the training data and training options in the MATLAB Workspace panel or visualize the network layers in the Deep Network Designer
app. You can also call the built-in training function trainNetwork and step through your metric functions:
In the MATLAB Command Window, call
trainNetworkusing the output of your setup function. For example, if your setup function is calledRegressionExperiment_setup, enter:[tNet,tInfo] = trainNetwork(RegressionExperiment_setup_output{:});Create a structure called
trialInfothat contains the fieldstrainedNetwork,trainingInfo, andparameters. For values, use the outputs of thetrainNetworkfunction and the hyperparameters used for training. For example, if your setup function is calledRegressionExperiment_setup, enter:trialInfo = struct(trainedNetwork=tNet, ... trainingInfo=tInfo, ... parameters=RegressionExperiment_setup_params);
In Experiment Manager, in the experiment definition tab, under Metrics, select the name of a metric function and click Edit. The metric function opens in MATLAB Editor.
In the metric function, set breakpoints as described in Set Breakpoints.

In the MATLAB Command Window, call the metric function using the
trialInfostructure as the input to the function. For example, if your metric function is calledAccuracy, enter:metricOutput = Accuracy(trialInfo)
MATLAB pauses at each line of code that has a breakpoint. When the function execution stops at the breakpoint, you can view the values of your variables, step through the code line-by-line, or continue to the next breakpoint. After the function runs to completion, examine the output value. The output must be a scalar number, a logical value, or a string.