Two-Dimensional Self-Organizing Map
As in one-dimensional problems, this self-organizing map will learn to represent different regions of the input space where input vectors occur. In this example, however, the neurons will arrange themselves in a two-dimensional grid, rather than a line.
We would like to classify 1000 two-element vectors in a rectangle.
X = rands(2,1000);
plot(X(1,:),X(2,:),'+r')
We will use a 5-by-6 layer of neurons to classify the vectors above. We would like each neuron to respond to a different region of the rectangle, and neighboring neurons to respond to adjacent regions.
The network is configured to match the dimensions of the inputs. This step is required here because we will plot the initial weights. Normally configuration is performed automatically when training.
net = selforgmap([5 6]);
net = configure(net,X);
We can visualize the network we have just created by using plotsompos.
Each neuron is represented by a red dot at the location of its two weights. Initially, all the neurons have the same weights in the middle of the vectors, so only one dot appears.
plotsompos(net)
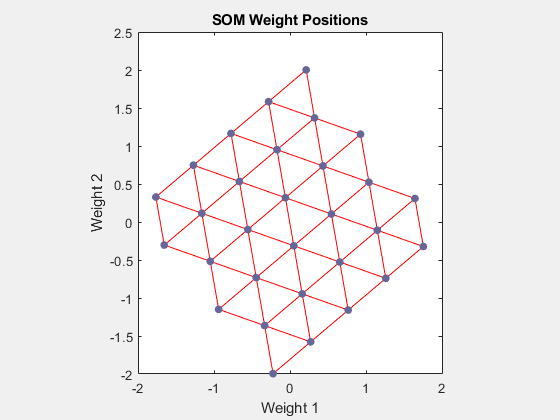
Now we train the map on the 1000 vectors for 1 epoch and replot the network weights.
After training, note that the layer of neurons has begun to self-organize so that each neuron now classifies a different region of the input space, and adjacent (connected) neurons respond to adjacent regions.
net.trainParam.epochs = 1;
net = train(net,X);

plotsompos(net)

We can now classify vectors by giving them to the network and seeing which neuron responds.
The neuron indicated by a "1" responded, so x belongs to that class.
x = [0.5;0.3];
y = net(x)
y = 30×1

     0
     0
     0
     0
     0
     0
     0
     0
     0
     0
     0
     0
     0
     0
     0
      ⋮