plotOutline
Display object outlines on bird's-eye plot
Description
plotOutline(
displays the rectangular outlines of cuboid objects on a bird's-eye plot.
Specify the position, yaw angle of rotation, length, and width of each cuboid.
The outline plotter, olPlotter,positions,yaw,length,width)olPlotter, is associated with a
birdsEyePlot object and
configures the display of the specified outlines.
To remove all outlines associated with outline plotter
olPlotter, call the clearData function and specify olPlotter as
the input argument.
To display the outlines of actors that are in a driving scenario, first use
targetOutlines to get the dimensions of the actors. Then, after
calling outlinePlotter to create a plotter object, use the
plotOutline function to display the outlines of all the
actors in a bird's-eye plot, except barriers. Use plotBarrierOutline function to display barriers.
plotOutline(___,
specifies options using one or more Name,Value)Name,Value pair
arguments and the input arguments from the previous syntax.
Examples
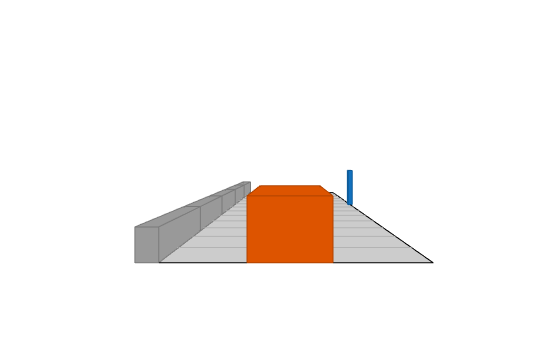
Create a driving scenario. Create a 25 m road segment with a barrier on its left edge. Add a pedestrian that crosses the road at 1 m/s, and a vehicle that drives along the road at 10 m/s.
scenario = drivingScenario;

r = road(scenario,[0 0 0; 25 0 0]);
barrier(scenario,r,'RoadEdge','left')

p = actor(scenario,'ClassID',4,'Length',0.2,'Width',0.4,'Height',1.7);
v = vehicle(scenario,'ClassID',1);

smoothTrajectory(p,[15 -3 0; 15 3 0],1)
smoothTrajectory(v,[v.RearOverhang 0 0; 25-v.Length+v.RearOverhang 0 0],10)
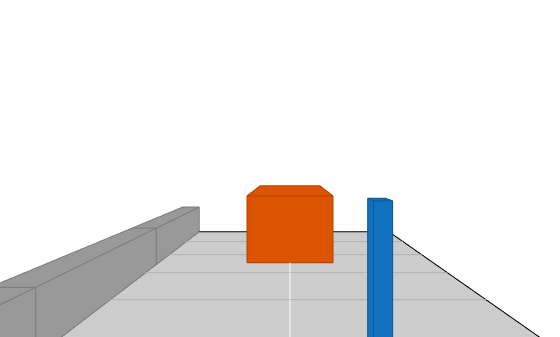
Use a chase plot to display the scenario from the perspective of the vehicle.
chasePlot(v,'Centerline','on')
Create a bird's-eye plot, outline plotter, and lane boundary plotter.
bep = birdsEyePlot('XLim',[-25 25],'YLim',[-10 10]);
olPlotter = outlinePlotter(bep);
lbPlotter = laneBoundaryPlotter(bep);
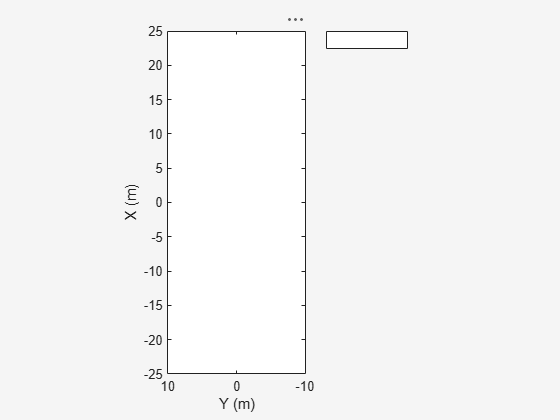
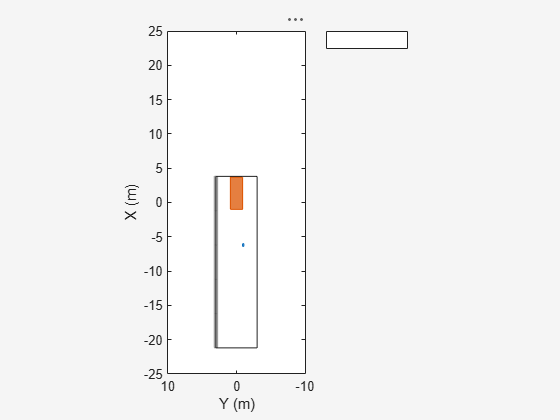
legend('off')Run the simulation loop. Update the plotter with outlines for the targets.
while advance(scenario)
   % Obtain the road boundaries and rectangular outlines.
   rb = roadBoundaries(v);
   [position,yaw,length,width,originOffset,color] = targetOutlines(v);
   [bposition,byaw,blength,bwidth,boriginOffset,bcolor,numBarrierSegments] = targetOutlines(v,'Barriers');

   % Update the bird's-eye plotters with the road, actors and barriers.
   plotLaneBoundary(lbPlotter,rb);
   plotOutline(olPlotter,position,yaw,length,width, ...
               'OriginOffset',originOffset,'Color',color);
   plotBarrierOutline(olPlotter,numBarrierSegments,bposition,byaw,blength,bwidth, ...
               'OriginOffset',boriginOffset,'Color',bcolor);
   % Allow time for plot to update.
   pause(0.01)
end
Input Arguments
Outline plotter, specified as an OutlinePlotter object.
This object is stored in the Plotters property of a
birdsEyePlot object and
configures the display of the specified outlines in the bird's-eye plot. To
create this object, use the outlinePlotter function.
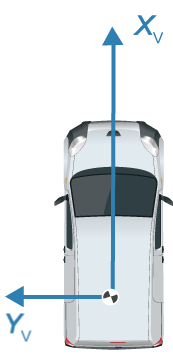
Positions of detected objects in vehicle coordinates, specified as an M-by-2 real-valued matrix of (X, Y) positions. M is the number of detected objects. The positive X-direction points ahead of the center of the vehicle. The positive Y-direction points to the left of the origin of the vehicle, which is the center of the rear axle, as shown in this figure of the vehicle coordinate system.
Angles of rotation for object outlines, specified as an M-element real-valued vector, where M is the number of objects.
Lengths of object outlines, specified as an M-element real-valued vector, where M is the number of objects.
Widths of object outlines, specified as an M-element real-valued vector, where M is the number of objects.
Name-Value Arguments
Version History
Introduced in R2017b