Main Content

idSaturation

Create a saturation nonlinearity estimator object

Syntax

NL = idSaturation
NL = idSaturation('LinearInterval',[a,b])

Description

NL = idSaturation creates a default saturation nonlinearity estimator object for estimating Hammerstein-Wiener models. The linear interval is set to [NaN NaN]. The initial value of the linear interval is determined from the estimation data range during estimation using nlhw. Use dot notation to customize the object properties, if needed.

NL = idSaturation('LinearInterval',[a,b]) creates a saturation nonlinearity estimator object initialized with linear interval, [a,b].

Alternatively, use NL = idSaturation([a,b]).

Object Description

idSaturation is an object that stores the saturation nonlinearity estimator for estimating Hammerstein-Wiener models.

Use idSaturation to define a nonlinear function y=F(x,θ), where y and x are scalars, and θ represents the parameters a and b that define the linear interval, [a,b].

The saturation nonlinearity function has the following characteristics:

ax<b              F(x)=xa>x                   F(x)=abx                   F(x)=b

For example, in the following plot, the linear interval is [-4,3].

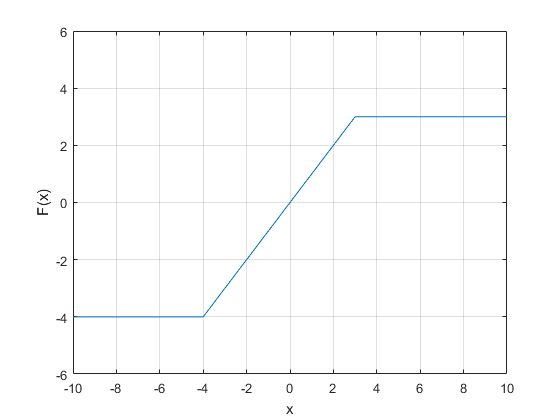
The value F(x) is computed by evaluate(NL,x), where NL is the idSaturation object.

For idSaturation object properties, see Properties.

Examples

collapse all

NL = idSaturation;

Specify the linear interval.

NL.LinearInterval = [-4,5];

Load data.

load twotankdata;
z = iddata(y,u,0.2,'Name','Two tank system');
z1 = z(1:1000);

Create a saturation object with lower limit of 0 and upper limit of 5.

InputNL = idSaturation('LinearInterval',[0 5]);

Estimate model with no output nonlinearity.

m = nlhw(z1,[2 3 0],InputNL,[]);

Load the estimation data.

load motorizedcamera;

Create an iddata object.

z = iddata(y,u,0.02,'Name','Motorized Camera','TimeUnit','s');

z is an iddata object with 6 inputs and 2 outputs.

Specify the model orders and delays.

Orders = [ones(2,6),ones(2,6),ones(2,6)];

Specify the same nonlinearity estimator for each input channel.

InputNL = idSaturation;

Specify different nonlinearity estimators for each output channel.

 OutputNL = [idDeadZone,idWaveletNetwork];

Estimate the Hammerstein-Wiener model.

sys = nlhw(z,Orders,InputNL,OutputNL);

To see the shape of the estimated input and output nonlinearities, plot the nonlinearities.

plot(sys)

Figure Hammerstein-Wiener Model Plot contains 6 axes objects and other objects of type uipanel, uicontrol. Axes object 1 with xlabel Input to nonlinearity at input "u1", ylabel Nonlinearity Value contains an object of type line. This object represents sys:idSaturation. Axes object 2 with xlabel Input to nonlinearity at input "u2", ylabel Nonlinearity Value contains an object of type line. This object represents sys:idSaturation. Axes object 3 with xlabel Input to nonlinearity at input "u3", ylabel Nonlinearity Value contains an object of type line. This object represents sys:idSaturation. Axes object 4 with xlabel Input to nonlinearity at input "u4", ylabel Nonlinearity Value contains an object of type line. This object represents sys:idSaturation. Axes object 5 with xlabel Input to nonlinearity at input "u5", ylabel Nonlinearity Value contains an object of type line. This object represents sys:idSaturation. Axes object 6 with xlabel Input to nonlinearity at input "u6", ylabel Nonlinearity Value contains an object of type line. This object represents sys:idSaturation.

Click on the input and output nonlinearity blocks on the top of the plot to see the nonlinearities.

Input Arguments

collapse all

Linear interval of the saturation, specified as a 2–element row vector of doubles.

The saturation nonlinearity is initialized at the interval [a,b]. The interval values are adjusted to the estimation data by nlhw. To remove the lower limit, set a to -Inf. The lower limit is not adjusted during estimation. To remove the upper limit, set b to Inf. The upper limit is not adjusted during estimation.

When the interval is [NaN NaN], the initial value of the linear interval is determined from the estimation data range during estimation using nlhw.

Example: [-2 1]

Properties

LinearInterval

Linear interval of the saturation, specified as a 2–element row vector of doubles.

Default: [NaN NaN]

Free

Option to fix or free the parameters of LinearInterval, specified as a 2–element logical row vector. When you set an element of Free to false, the corresponding value in LinearInterval remains fixed during estimation to the initial value that you specify.

Default: [true true]

Output Arguments

collapse all

Saturation nonlinearity estimator object, returned as an idSaturation object.

Version History

Introduced in R2007a

expand all