Estimate Hammerstein-Wiener Models Initialized Using Linear OE Models
This example shows how to estimate Hammerstein-Wiener models using linear OE models.
Load the estimation data.
load throttledata.matThis command loads the data object ThrottleData into the workspace. The object contains input and output samples collected from an engine throttle system, sampled at a rate of 100Hz.
A DC motor controls the opening angle of the butterfly valve in the throttle system. A step signal (in volts) drives the DC motor. The output is the angular position (in degrees) of the valve.
Plot the data to view and analyze the data characteristics.
plot(ThrottleData)
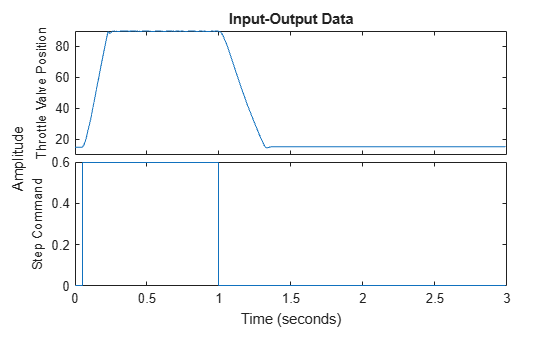
In the normal operating range of 15-90 degrees, the input and output variables have a linear relationship. You use a linear model of low order to model this relationship.
In the throttle system, a hard stop limits the valve position to 90 degrees, and a spring brings the valve to 15 degrees when the DC motor is turned off. These physical components introduce nonlinearities that a linear model cannot capture.
Estimate a Hammerstein-Wiener model to model the linear behavior of this single-input single-output system in the normal operating range.
% Detrend the data because linear models cannot capture offsets.
Tr = getTrend(ThrottleData);
Tr.OutputOffset = 15;
DetrendedData = detrend(ThrottleData,Tr);

% Estimate a linear OE model with na=2, nb=1, nk=1.
opt = oeOptions('Focus','simulation');
LinearModel = oe(DetrendedData,[2 1 1],opt);
Compare the simulated model response with estimation data.
compare(DetrendedData, LinearModel)
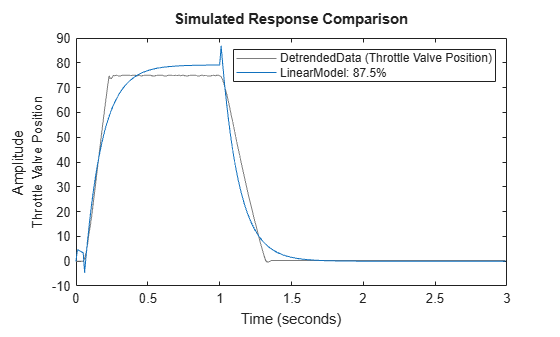
The linear model captures the rising and settling behavior in the linear operating range but does not account for output saturation at 90 degrees.
Estimate a Hammerstein-Wiener model to model the output saturation.
NonlinearModel = nlhw(ThrottleData, LinearModel, [], idSaturation);
The software uses the orders and delay of the linear model for the orders of the nonlinear model. In addition, the software uses the B and F polynomials of the linear transfer function.
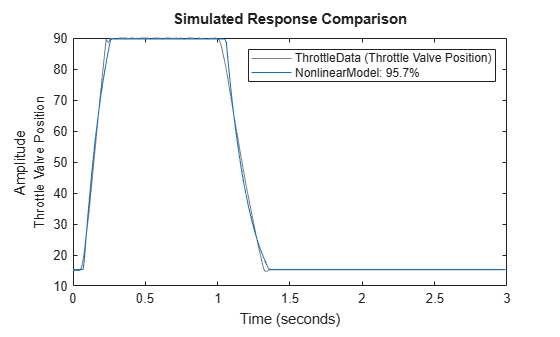
Compare the nonlinear model with data.
compare(ThrottleData, NonlinearModel)