Generate and Read Waveform Data from Oscilloscope Using VISA Explorer App
This example shows how to use the VISA Explorer app to send SCPI (Standard Commands for Programmable Instruments) commands to an oscilloscope with built-in function generator. The example then shows how to generate and read a modulated sinusoid waveform.
Requirements
To run this example, you need a Keysight Technologies® InfiniiVision 1000 X-Series oscilloscope with a built-in function generator. This example uses the Keysight Technologies DSO-X 1102G oscilloscope, which connects via USB and requires the Instrument Control Toolbox™ Support Package for Keysight IO Libraries and VISA Interface.
Connect to Oscilloscope
Open the VISA Explorer app by entering the following command at the MATLAB® command prompt.
visaExplorer
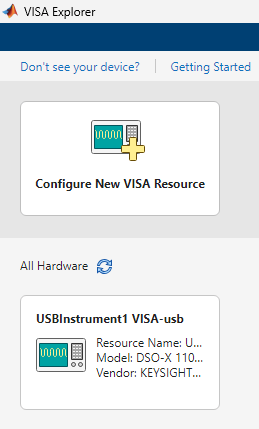
Select the oscilloscope in the All Hardware section of the start page. Because the oscilloscope is connected via USB, it is listed as a USBInstrument.
If your oscilloscope does not connect via USB or does not appear in the All Hardware section, click Configure New VISA Resource to manually configure the oscilloscope.
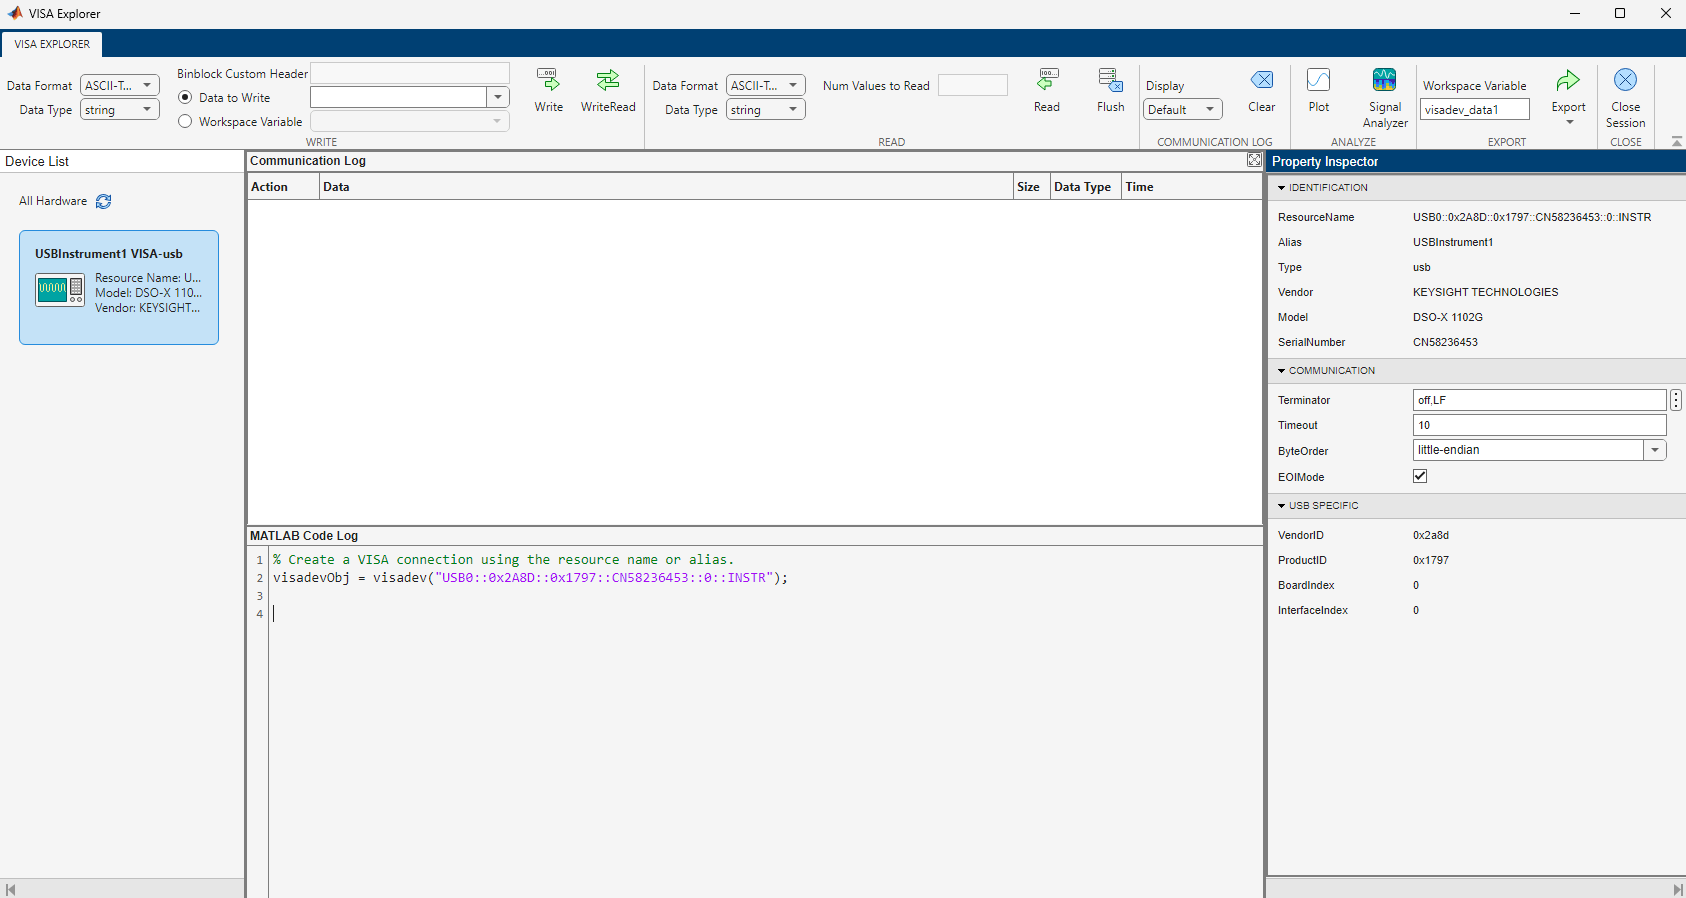
VISA Explorer opens and automatically connects to the oscilloscope.
Test Connection to Oscilloscope
To verify that the oscilloscope is connected and can communicate properly, use options in the Write section of the toolstrip to send a command to the oscilloscope. In the Data to Write box, type *IDN? and then click WriteRead. The *IDN? command queries the oscilloscope for its model and identification number.
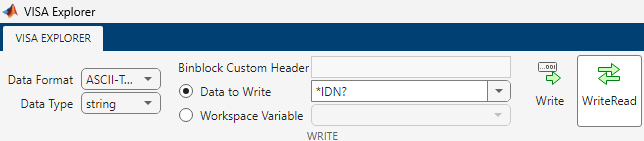
When you click WriteRead, the app writes the command to the oscilloscope and automatically reads the data sent in response to the query. As you send commands, the app updates the Communication Log to show the communication history.

In the Data to Write box, type *RST and then click Write. The *RST command resets the oscilloscope to the default setup. The oscilloscope displays a flat signal.
Generate Waveform
Next, you need to enable the built-in waveform generator. In the Data to Write box, type :WGEN:OUTPUT 1 and then click Write.
Using the same approach, write the following commands to generate a sinusoid waveform and set the waveform's frequency and voltage.
:WGEN:FUNCTION SIN
:WGEN:FREQUENCY +5.0E+03
:WGEN:VOLTAGE 1.5E+00
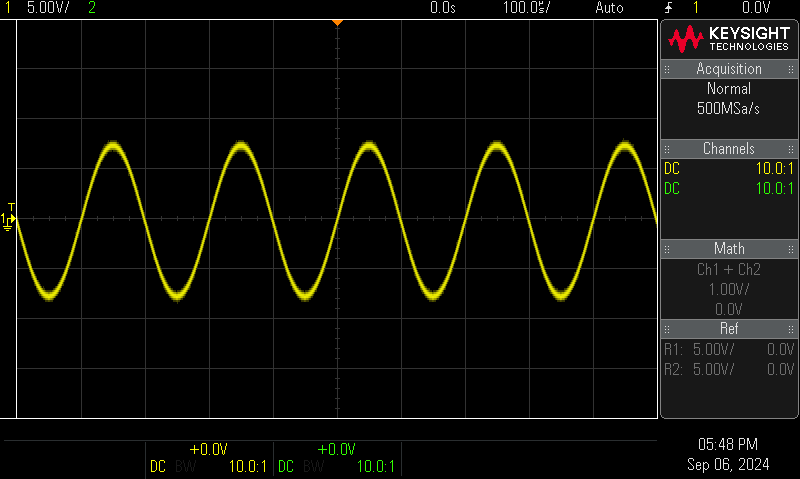
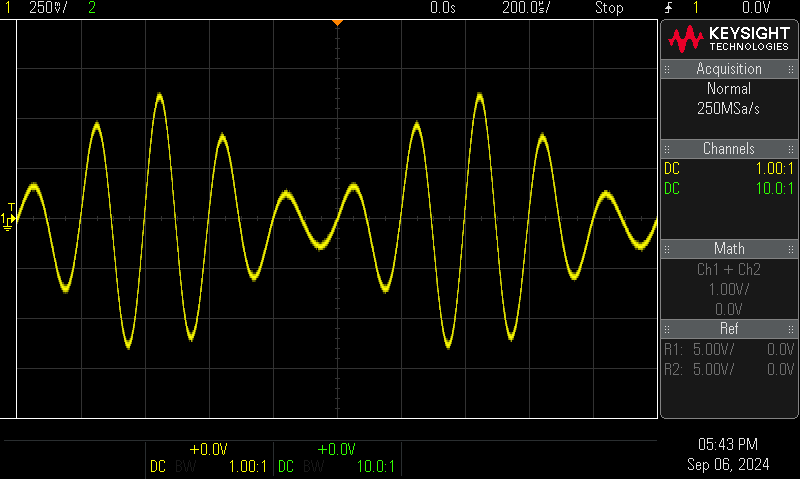
The oscilloscope display shows the generated waveform.
To enable waveform modulation, write the following command.
:WGEN:MODULATION:STATE 1
To specify sinusoid amplitude modulation and set the modulation depth, write the following commands.
:WGEN:MODULATION:TYPE AM
:WGEN:MODULATION:FUNCTION SIN
:WGEN:MODULATION:AM:DEPTH 70
Acquire Waveform
Next you need to configure the oscilloscope for waveform display and acquisition, and then read the waveform data into VISA Explorer.
Configure Oscilloscope
To prepare the oscilloscope for waveform acquisition, write the following commands.
Specify one-to-one probe attenuation, and set the horizontal and vertical ranges of the display.
:CHAN1:PROBE 1
:TIMEBASE:RANGE +2.0E-03
:CHAN1:RANGE +2.0E+00
Specify normal acquisition type. Set the waveform source to the channel connected to the oscilloscope's Gen Out port, in this case, Channel 1. Set the waveform format to 16-bit word, and direct the oscilloscope to send the least significant byte first.
:ACQUIRE:TYPE NORMAL
:WAVEFORM:SOURCE CHAN1
:WAVEFORM:FORMAT WORD
:WAVEFORM:BYTEORDER LSBFIRST
Read Waveform Data
Instruct the oscilloscope to capture the waveform data by writing the following command.
:DIGITIZE CHAN1
To query the oscilloscope for the waveform data, write the following command.
:WAVEFORM:DATA?
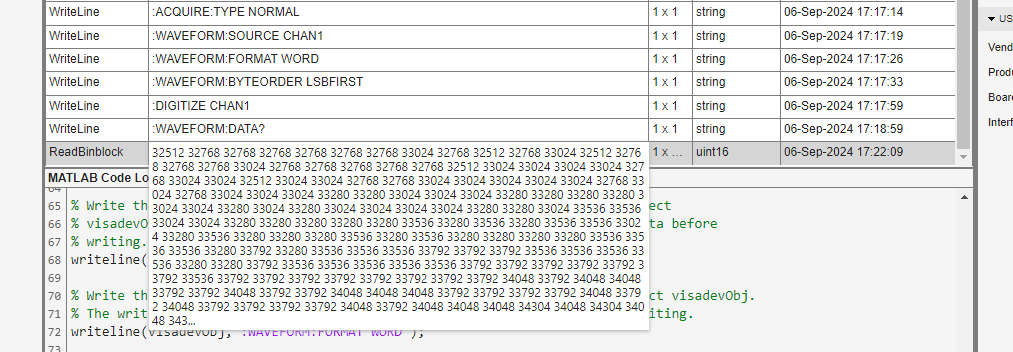
To read the captured waveform data from the oscilloscope, use the options in the Read section of the toolstrip. For Data Format, select Binblock. For Data Type, select uint16. Then click Read.

The app displays a preview of the data in the Communication Log.
Verify Waveform Acquisition
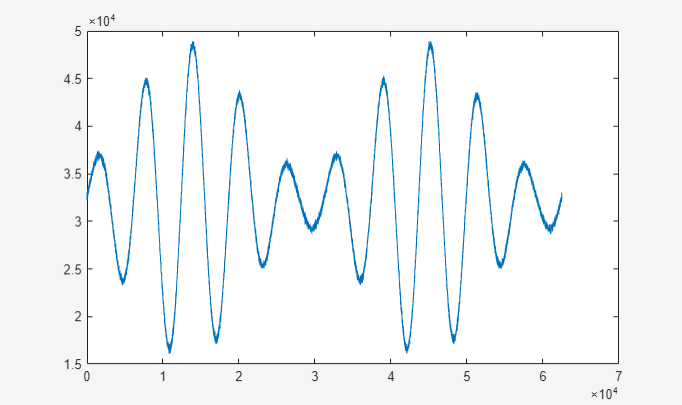
Click on the row of the Communication Log that contains the waveform data. In the Analyze section of the toolstrip, click Plot to visualize the data. Compare the plot to the oscilloscope display to confirm that the waveform acquisition is successful.
For additional analysis, you can visualize the waveform in the Signal Analyzer app by clicking Signal Analyzer in the Analyze section of the toolstrip. Signal Analyzer requires Signal Processing Toolbox™.
You can perform data processing and advanced plotting outside VISA Explorer by exporting the data. In the Export section of the toolstrip, click Export > Export Selected Row to export the data to the MATLAB workspace.
Generate MATLAB Script
VISA Explorer captures your interactions with the oscilloscope and displays the associated MATLAB commands in the MATLAB Code Log.
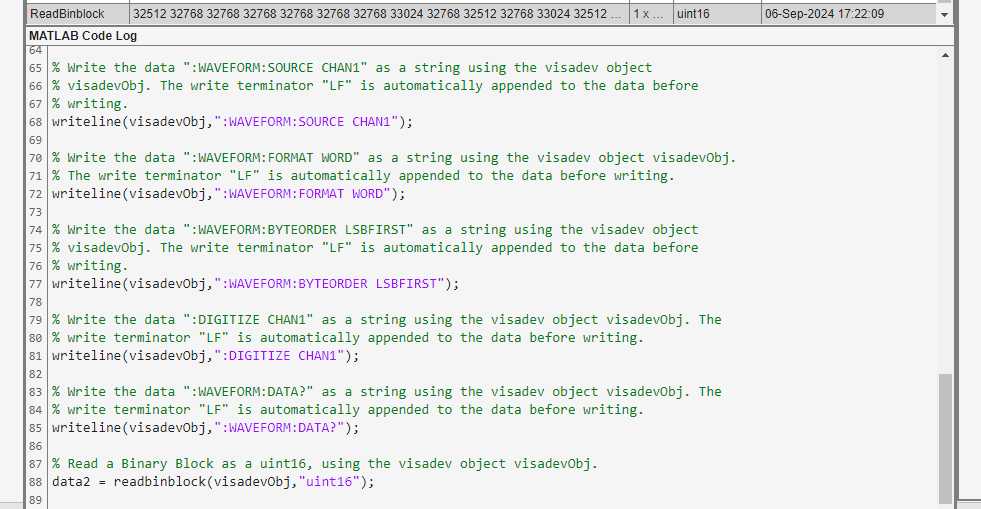
To reproduce the code outside the app, you can generate a MATLAB script containing these commands.
In the Export section of the toolstrip, click Export > Generate MATLAB Script. The script opens in the MATLAB Editor. You can run this script to configure the oscilloscope and regenerate the waveform.
Close Connection to Oscilloscope
In the Close section of the toolstrip, click Close Session. The software closes the VISA Explorer session and ends the connection to the oscilloscope.