Add Data Tips to Point, Line, and Polygon Shapes
Create and customize data tips on point, line, and polygon shapes created using the
geoplot function. Programmatically add data tips by using the
datatip function, or interactively add data tips by pausing on,
clicking, or tapping the shape.
Data tips appear on plotted point, line, or polygon shapes when the plotted shape meets one or more of these conditions.
You apply color by specifying the
ColorDataorColorVariableproperty of the plotted shape object. In this case, the data tips contain the color data.You change the content or appearance of the data tip by updating the
DataTipTemplateproperty of the plotted shape object. In this case, the data tips reflect the changes you made to the template.You plot a vector of individual point shapes where the
NumPointsproperty of each shape object is1. In this case, the data tips contain the latitude and longitude coordinates of the data points.
Programmatically Add Data Tips
Programmatically add data tips by using the datatip function.
Point Shapes
Read a shapefile containing world land areas into the workspace. Then, display the land areas on a map. Avoid creating data tips on the land areas by specifying the PickableParts name-value argument as "none".
land = readgeotable("landareas.shp");

figure
newmap
geoplot(land,PickableParts="none")
Read a shapefile containing world cities into the workspace as a geospatial table. The table represents the cities using point shapes in geographic coordinates.
cities = readgeotable("worldcities.shp");Data tips on point shapes include coordinates when each plotted shape represents an individual point. Verify that each shape represents one point by using the ismultipoint and all functions.
tf = ~ismultipoint(cities.Shape);
all(tf,"all")
ans = logical
1
Display the cities on the same map. Prepare to add data tips to the points by returning the Point object as pt. Then, add a data tip by using the datatip function, the Point object, and the latitude-longitude coordinates of a city.
hold on
pt = geoplot(cities);

ptDt = datatip(pt,-31.95,115.83);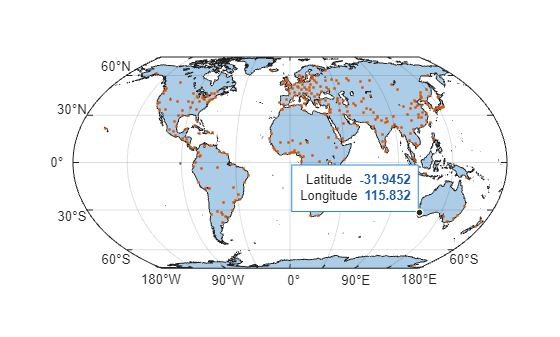
Add a new row to the data tip. Create the row by using the dataTipTextRow function. For the label, use Name. For the values, use the city names stored in the geospatial table. Then, add the row to the data tip by changing the DataTipTemplate property of the Point object.
ptDtRow = dataTipTextRow("Name",cities.Name);
pt.DataTipTemplate.DataTipRows(end+1) = ptDtRow;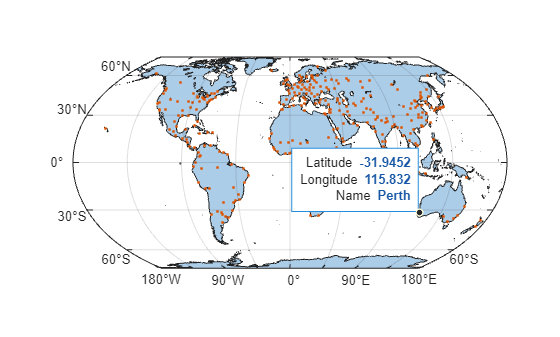
Line Shapes
Read a shapefile containing road data into the workspace as a geospatial table. The table represents the roads using line shapes in projected coordinates.
roads = readgeotable("concord_roads.shp");Display the roads on a map. Vary the line colors according to the road type, which is stored in the CLASS variable of the table. Prepare to add data tips to the lines by returning the Line object as pl.
figure
pl = geoplot(roads,ColorVariable="CLASS");
Find the table row that contains a line for Craig Road. Then, add a data tip to the line by using the datatip function and the DataIndex name-value argument.
idxCR = find(roads.STREETNAME == "CRAIG ROAD");
plDt = datatip(pl,DataIndex=idxCR);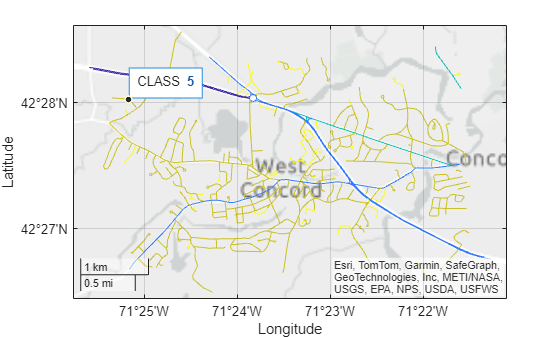
Change the data tip label from CLASS to Type by accessing the DataTipTemplate property of the Line object and setting the Label property.
pl.DataTipTemplate.DataTipRows(1).Label = "Type"; Add a new row to the data tip. First, create the row by using the dataTipTextRow function. For the label, use Name. For the values, use the street names stored in the geospatial table. Then, add the row to the data tip by changing the DataTipTemplate property of the Line object.
plDtRow = dataTipTextRow("Name",roads.STREETNAME);
pl.DataTipTemplate.DataTipRows(end+1) = plDtRow;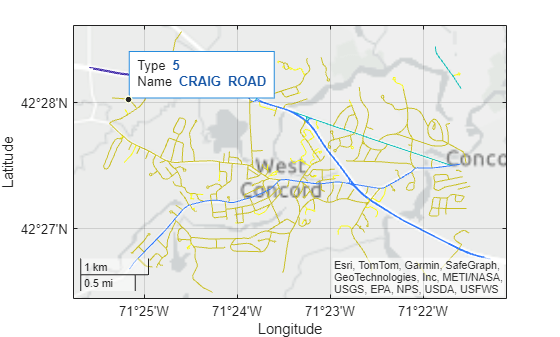
Polygon Shapes
Read a shapefile of US states into the workspace as a geospatial table. The shapefile represents the states using polygon shapes in geographic coordinates. Create a subtable that includes several midwest states: Minnesota, Iowa, Wisconsin, Illinois, Indiana, Ohio, and Michigan.
states = readgeotable("usastatelo.shp");
names = ["Minnesota","Iowa","Wisconsin","Illinois","Indiana","Ohio","Michigan"];
mwStates = geocode(names,states);
Add table variables that contain the area and perimeter of each state. Find the conversion factor from meters to kilometers by using the unitsratio function.
mToKm = unitsratio("km","m");

areaOfStates = area(mwStates.Shape)*(mToKm^2);
mwStates.Area = areaOfStates;

perimeterOfStates = perimeter(mwStates.Shape)*mToKm;
mwStates.Perimeter = perimeterOfStates;
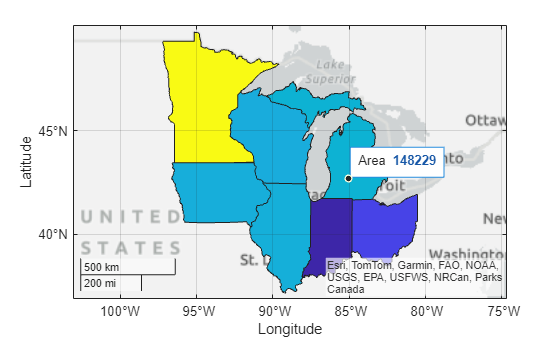
Display the states on a map, and vary the polygon colors according to the area. Prepare to add data tips to the polygons by returning the Polygon object as pg.
figure
pg = geoplot(mwStates,ColorVariable="Area");
Find the table row that contains a polygon shape for Michigan. Note that the polygon contains multiple regions.
idxMI = find(mwStates.Name == "Michigan");
mwStates.Shape.NumRegions(idxMI)
ans = 2
Add a data tip to the polygon by using the datatip function and the DataIndex name-value argument. The data tip appears on the lower peninsula of Michigan.
pgDt1 = datatip(pg,DataIndex=idxMI);
Create a data tip on the upper peninsula by specifying latitude-longitude coordinates within the peninsula and by specifying the SnapToDataVertex name-value argument as "off".
pgDt2 = datatip(pg,46.15,-87.47,SnapToDataVertex="off");Remove the first data tip.
delete(pgDt1)

Add two new rows to the data tip. First, create the rows by using the dataTipTextRow function. For the labels, use Name and Perimeter. For the values, use the names and perimeters stored in the geospatial table. Then, add the rows to the data tip by changing the DataTipTemplate property of the Polygon object.
pgDtRows = [dataTipTextRow("Name",mwStates.Name) ...
    dataTipTextRow("Perimeter",mwStates.Perimeter)];
pg.DataTipTemplate.DataTipRows(end+1:end+2) = pgDtRows;
Switch the first and second rows of the data tip.
pg.DataTipTemplate.DataTipRows([1 2]) = pg.DataTipTemplate.DataTipRows([2 1]);

Interactively Add Data Tips
Interactively add data tips by pausing on, clicking, or tapping the plot.
Read a shapefile of US states into the workspace as a geospatial table. The shapefile represents the states using polygon shapes in geographic coordinates. Create a subtable that includes several midwest states: Minnesota, Iowa, Wisconsin, Illinois, Indiana, Ohio, and Michigan.
states = readgeotable("usastatelo.shp");
names = ["Minnesota","Iowa","Wisconsin","Illinois","Indiana","Ohio","Michigan"];
mwStates = geocode(names,states);
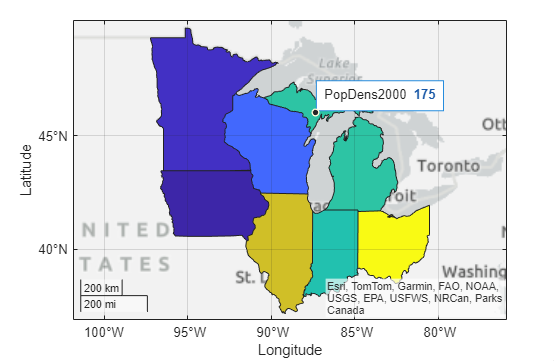
Display the states on a map and vary the polygon colors according to the population density of the state in the year 2000.
figure
geoplot(mwStates,ColorVariable="PopDens2000")
Note that the polygon shape for Michigan has two regions: a lower peninsula and an upper peninsula. Add a data tip by clicking Michigan. Regardless of the region you click, the data tip appears on the lower peninsula.

To add a data tip to a different region of the polygon, change the data tip
placement method of the geographic axes object to
"interpolate".
gx = gca;
gx.InteractionOptions.DatatipsPlacementMethod = "interpolate";
Remove the existing data tip by clicking it. Then, add a new data tip by clicking the upper peninsula.
Tips
In most cases, data tips for plotted shapes do not include coordinate data. Data tips on individual point shapes display geographic coordinates, even when the data originates in projected coordinates.
Data tips for line and polygon shapes do not typically appear at the locations you specify.
For data tips created using the
datatipfunction, you can display data tips at the closest interpolated coordinates by specifying theSnapToDataVertexname-value argument as"off".For data tips created interactively, you can display data tips at the closest interpolated location by changing the data tip placement method of the parent axes object.
ax = gca;
ax.InteractionOptions.DatatipsPlacementMethod = "interpolate";
When you add data tip rows to multipoint, line, or polygon shape objects without specifying the
ColorDataorColorVariableproperty of the object, the first row of the data tip contains the labelRowand the index of the plotted data.Even when data tips do not contain content, the pointer displays a crosshair when you pause on a plotted shape.