Create Maps of World and US Regions
This topic shows how to create maps of world regions and maps of regions in the United
States by using the worldmap and usamap
functions. Each function creates an axesm-based map and then
automatically selects the projection, limits, and other properties based on the region
you specify.
Optionally, after you set up a map using the worldmap or
usamap function, you can customize the map by using the
setm function.
Create Maps of World Regions
Create a map of a world region by using the worldmap function.
Create a map of South America. The worldmap function creates an axesm-based map and picks an appropriate map projection.
figure
worldmap("South America")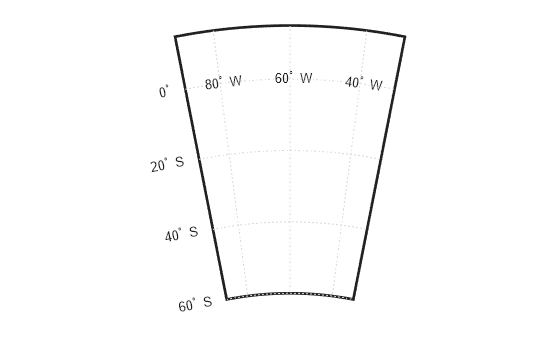
Find the map projection by querying the MapProjection property of the axesm-based map. The result 'eqdconic' means that the map uses an Equidistant Conic projection.
ax = gca;
getm(ax,"MapProjection")
ans = 'eqdconic'
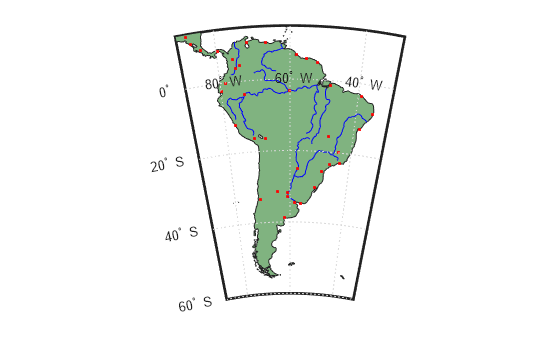
Display world land areas, rivers, and cities from shapefiles by using the geoshow function. Use green for the land areas, blue for the rivers, and black for the cities.
geoshow("landareas.shp","FaceColor",[0.5 0.7 0.5])
geoshow("worldrivers.shp","Color","blue")
geoshow("worldcities.shp","Marker",".","Color","red")
Create Maps of US Regions
Create a map of a region in the United States by using the usamap function. The usamap function enables you to create maps of the entire United States, the conterminous United States, groups of states, or a single state.
Create a map of the Chesapeake Bay region. The usamap function creates an axesm-based map and picks an appropriate map projection.
figure
usamap([37 40],[-78 -74]);

Find the map projection by querying the MapProjection property of the axesm-based map. The result 'lambert' means that the map uses a Lambert Conformal Conic projection, which is often used for maps of the conterminous United States.
ax = gca;
getm(ax,"MapProjection")
ans = 'lambert'
Read a shapefile of US states into the workspace. The function returns the data in a geospatial table.
states = readgeotable("usastatehi.shp");Define the colors of the states by creating a symbol specification. Create a colormap of random, muted colors by using the polcmap function.
h = height(states);
faceColors = makesymbolspec('Polygon',{'INDEX',[1 h],'FaceColor',polcmap(h)});
Display the US states by using the geoshow function. Specify the color of each state using the symbol specification.
geoshow(states,"SymbolSpec",faceColors)
Add text labels to the map by using the textm function. Get the latitudes, longitudes, and state names from the geospatial table.
lat = states.LabelLat;
lon = states.LabelLon;
name = states.Name;
textm(lat,lon,name,"HorizontalAlignment","center")
textm(38.2,-76.1," Chesapeake Bay ","FontWeight","bold","Rotation",270)
