geoshow
Display map latitude and longitude data
Syntax
Description
geoshow(
projects and displays the latitude and longitude vectors lat,lon)lat
and lon using the projection stored in the current
axesm-based map (previously referred to as map axes).
If there is no current axesm-based map, then
lat and lon are projected using a
default Plate Carrée projection on a set of regular axes.
Note
To display data on an axesm-based map, create a
map using the axesm, worldmap, or usamap function before
calling geoshow.
By default, geoshow displays lat and
lon as lines. You can optionally display the vector data
as points, multipoints, or polygons by using the
DisplayType name-value pair argument.
geoshow( displays the vector
geographic features stored in S)S as points, multipoints,
lines, multilines, polygons, or multipolygons according to the geometry of
S.
You can optionally specify symbolization rules using the
SymbolSpec name-value pair argument.
geoshow(
projects and displays the geolocated data grid, lat,lon,Z)Z. In this
syntax, lat and lon are M-by-N
latitude-longitude arrays. Z is an M-by-N array of class
double. You can optionally display the data as a surface,
mesh, texture map, or contour by using the DisplayType
name-value pair argument.
geoshow(
projects and displays a regular data grid, Z,R)Z, with
referencing object R. You can optionally display the data
as a surface, mesh, texture map, or contour by using the
DisplayType name-value pair argument. If
DisplayType is 'texturemap', then
geoshow constructs a surface with
ZData values set to 0.
geoshow(
projects and displays a geolocated image as a texture map on a zero-elevation
surface. The geolocated image lat,lon,X,cmap)I can be a truecolor,
grayscale, or binary image. X is an indexed image with
colormap cmap. Examples of geolocated images include a
color composite from a satellite swath or an image originally referenced to a
different coordinate system.
geoshow(___,
specifies parameters and corresponding values that modify the type of display or
set MATLAB® graphics properties. You can use name,value pairs to set:Name,Value)
Name,ValueargumentsAny MATLAB Graphics line, patch, and surface properties
Any Mapping Toolbox™ contour properties
Parameter names can be abbreviated, and case does not matter.
geoshow( sets the
parent axes to ax,___)ax.
h = geoshow(___)
Examples
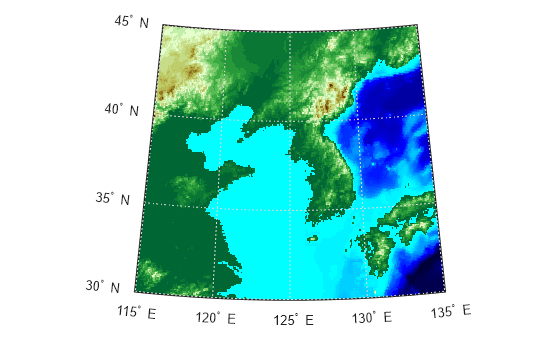
Load elevation data and a geographic cells reference object for the Korean peninsula. Create a map for the Korean peninsula using worldmap.
load korea5c
worldmap(korea5c,korea5cR)
Display the elevation data as a texture map. Apply a colormap appropriate for elevation data using demcmap.
geoshow(korea5c,korea5cR,'DisplayType','texturemap')
demcmap(korea5c)
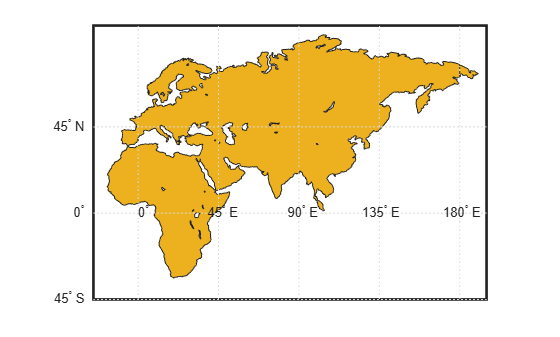
Geocode a world region that contains Africa, Europe, and Asia. The output geospatial table represents the region using a polygon. Get information about the polygon by querying the Shape variable of the table.
land = readgeotable("landareas.shp");
GT = geocode("Africa and Eurasia",land);
GT.Shape
ans =
  geopolyshape with properties:

              NumRegions: 2
                NumHoles: 22
                Geometry: "polygon"
    CoordinateSystemType: "geographic"
           GeographicCRS: [1×1 geocrs]
Display the polygon on a world map.
worldmap([-45 80],[-25 195]);
geoshow(GT)
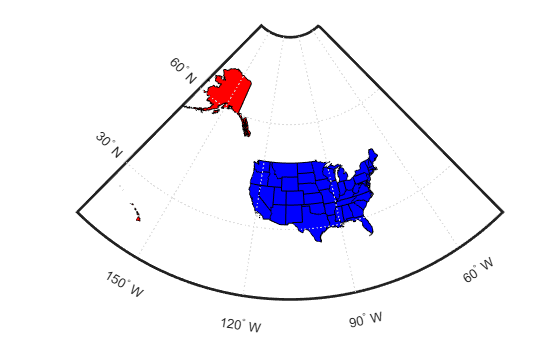
Import a shapefile containing USA state polygons as a geospatial table. Create a map using a projection and limits suitable for displaying all 50 states.
states = readgeotable("usastatehi.shp");
figure
worldmap("na")
Create a symbol specification that sets the color of the Alaska and Hawaii polygons to red.
symspec = makesymbolspec("Polygon", ...
   {'Name','Alaska','FaceColor','red'}, ...
   {'Name','Hawaii','FaceColor','red'});
Display all the state polygons. Set the default face color to blue and the default edge color to black.
geoshow(states,"SymbolSpec",symspec, ...
   "DefaultFaceColor","blue", ...
   "DefaultEdgeColor","black");
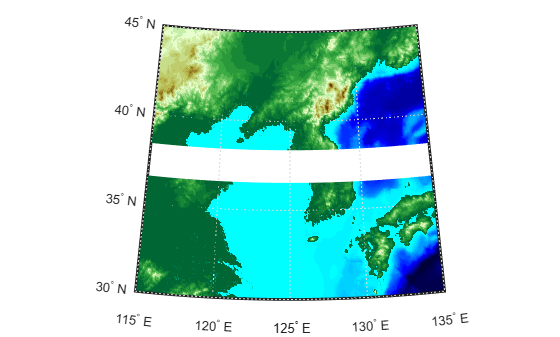
Load elevation data and a geographic cells reference object for the Korean peninsula. Insert a band of null values into the elevation data.
load korea5c
korea5c(80:100,:) = NaN;
Create a map for the Korean peninsula using worldmap. Then, display the elevation data as a surface with transparent null values.
worldmap(korea5c,korea5cR)
geoshow(korea5c,korea5cR,'DisplayType','surface')
demcmap(korea5c)
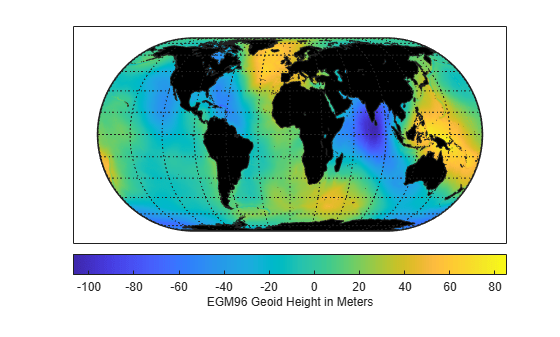
Get geoid heights and a geographic postings reference object from the EGM96 geoid model. Then, display the geoid heights as a surface using an Eckert projection. Ensure the surface appears under the land mask by setting the 'CData' name-value pair to the geoid height data and the 'ZData' name-value pair to a matrix of zeros. Display the frame and grid of the map using framem and gridm.
[N,R] = egm96geoid;
axesm eckert4
Z = zeros(R.RasterSize);
geoshow(N,R,'DisplayType','surface','CData',N,'ZData',Z)
framem
gridm
Create a colorbar and add a text description. Then, mask out all the land.
cb = colorbar('southoutside');
cb.Label.String = 'EGM96 Geoid Height in Meters';
geoshow('landareas.shp','FaceColor','black')
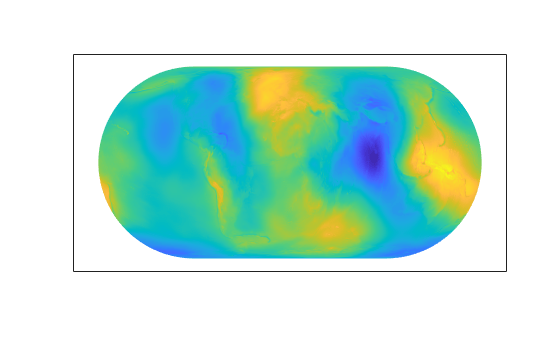
Get geoid heights and a geographic postings reference object from the EGM96 geoid model. Then, display the geoid heights as a surface using an Eckert projection.
[N,R] = egm96geoid;
axesm eckert4
geoshow(N,R,'DisplayType','surface')
Add light and material. Then, view the map as a 3-D surface.
light
material(0.6*[1 1 1])
axis normal
view(3)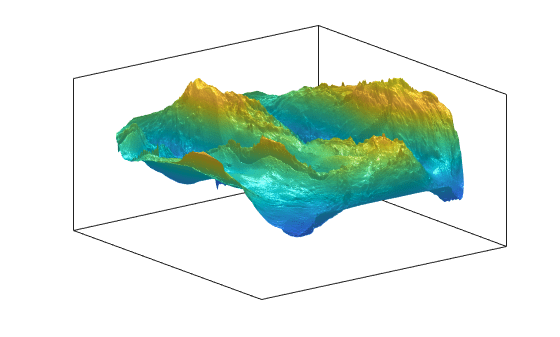
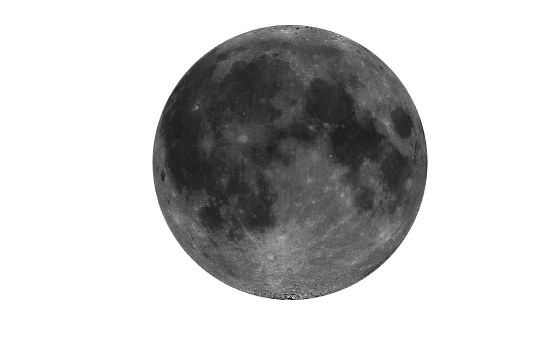
Load moon albedo data and a geographic cells reference object.
load moonalb20cThen, display the data. To do this, create a map and specify its projection as orthographic. Display the data as a texture map using the geoshow function. Then, change the colormap to grayscale and remove the axis lines.
axesm ortho
geoshow(moonalb20c,moonalb20cR,'DisplayType','texturemap')
colormap gray
axis off
Input Arguments
Name-Value Arguments
Output Arguments
Tips
When calling
shapereadto read files that contain coordinates in latitude and longitude, be sure to specify theshapereadargument pair'UseGeoCoords',true. If you do not include this argument,shapereadwill create a mapstruct, with coordinate fields labelledXandYinstead ofLonandLat. In such cases,geoshowassumes that the geostruct is in fact a mapstruct containing projected coordinates, warns, and callsmapshowto display the geostruct data without projecting it.If you do not want
geoshowto draw on top of an existing map, create a new figure or subplot before calling it.When you display vector data in an
axesm-based map usinggeoshow, you should not subsequently change the map projection usingsetm. You can, however, change the projection withsetmfor raster data. For more information, see Change Map Projections When Using geoshow.If you display a polygon, do not set
'EdgeColor'to either'flat'or'interp'. This combination may result in a warning.When projecting data onto an
axesm-based map,geoshowuses the projection stored within theaxesm-based map. When displaying on a regular axes, it constructs a default Plate Carrée projection with a scale factor of180/pi, enabling direct readout of coordinates in degrees.When you pass two points to the
geoshowfunction, the function projects the locations of each point on the map and displays a straight line that connects them, regardless of the map projection or the distance between the points. To display a projected geodesic or rhumbline curve between two points, first insert intermediate points using thetrack2function.geoshowcan generally be substituted fordisplaym. However, there are limitations where display of specific objects is concerned. See the remarks underupdategeostructfor further information.
When you display raster data in a map using
geoshow, columns near the eastern or western edge may fail to display. This is seldom noticeable, except when the raster is very coarse relative to the displayed area. To include additional columns in the display, it might help to:Resize the grid to a finer mesh.
Make sure the cell boundaries and map limits align.
Expand the map limits.
Alternative Functionality
The geoshow function typically displays data on
axesm-based maps. To display data in 2-D using geographic axes
or map axes, use these functions instead:
For a comparison of 2-D map display options, including when to use each type of display, see Choose a 2-D Map Display.
Version History
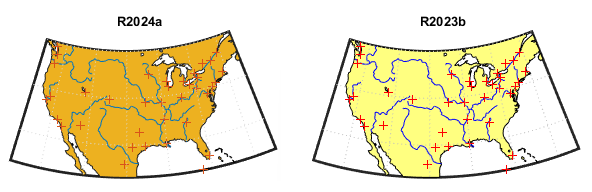
Introduced before R2006aWhen you plot vector data using the geoshow function, the
function uses different default colors. This image compares the default colors of
points, lines, and polygons in R2024a and R2023b.