Change Map Projections When Using geoshow
You can display latitude-longitude raster and vector data on
axesm-based maps by using the geoshow function. When you change the projection of an
axesm-based map that contains raster data plotted by the
geoshow function, MATLAB® reprojects the raster data. However, if the map contains vector data
plotted by the geoshow function, MATLAB does not reproject the vector data. To reproject vector data, you must
remove the vector data from the map and then plot it again.
Change Map Projections When Using geoshow
Change the map projection of an axesm-based map after displaying raster and vector data using the geoshow function.
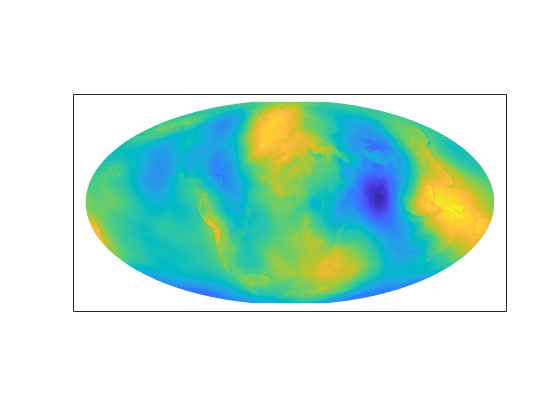
Reproject Raster Data
When you change the projection of an axesm-based map that contains raster data plotted by the geoshow function, MATLAB reprojects the raster data.
Set up an axesm-based map that uses a Mercator projection.
figure
axesm mercator
Display raster data on the map by using the geoshow function. For this example, display geoid heights from the EGM96 geoid model.
[N,R] = egm96geoid;
geoshow(N,R,"DisplayType","surface")

Change the map projection to use a Mollweide projection.
ax = gca;
setm(ax,"MapProjection","mollweid")
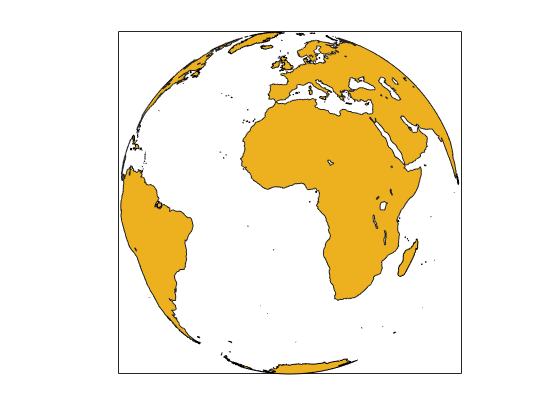
Reproject Vector Data
When you change the projection of an axesm-based map that contains vector data plotted by the geoshow function, MATLAB does not reproject the vector data. To reproject the vector data, you must remove the vector data from the map and then plot it again.
Set up an axesm-based map that uses a Miller projection.
figure
axesm miller
Display vector data on the map by using the geoshow function. For this example, display a shapefile containing world land areas. Return the plot objects in v.
v = geoshow("landareas.shp");
To reproject the map, first delete the plot objects. Change the map projection to use an orthographic projection. Then, plot the data again.
delete(v)

ax = gca;
setm(ax,"MapProjection","ortho")

geoshow("landareas.shp")