Determine and Visualize Visibility Across Terrain
You can use regular data grids of elevation data to answer questions about the mutual visibility of locations on a surface (intervisibility). For example,
Is the line of sight from one point to another obscured by terrain?
What area can be seen from a location?
What area can see a given location?
The first question can be answered with the los2 function. In its
simplest form, los2 determines the visibility between two points on
the surface of a digital elevation map. You can also specify the altitudes of the
observer and target points, as well as the datum with respect to which the altitudes are
measured. For specialized applications, you can even control the actual and effective
radius of the Earth. This allows you to assume, for example, that the Earth has a radius
1/3 larger than its actual value, a setting which is frequently used in modeling radio
wave propagation.
Compute Line of Sight
The following example shows a line-of-sight calculation between two points on a
regular data grid generated by the peaks function. The
calculation is performed by the los2 function, which returns a
logical result: 1 (points are mutually
visible—intervisible), or 0
(points are not intervisible).
Create an elevation grid using
peakswith a maximum elevation of 500, and set its origin at (0°N, 0°W), with a spacing of 1000 cells per degree):map = 500*peaks(100); maplegend = [ 1000 0 0];
Define two locations on this grid to test intervisibility:
lat1 = -0.027;
lon1 = 0.05;
lat2 = -0.093;
lon2 = 0.042;
Calculate intervisibility. The final argument specifies the altitude (in meters) above the surface of the first location (
lat1,lon1) where the observer is located (the viewpoint):los2(map,maplegend,lat1,lon1,lat2,lon2,100) ans = 1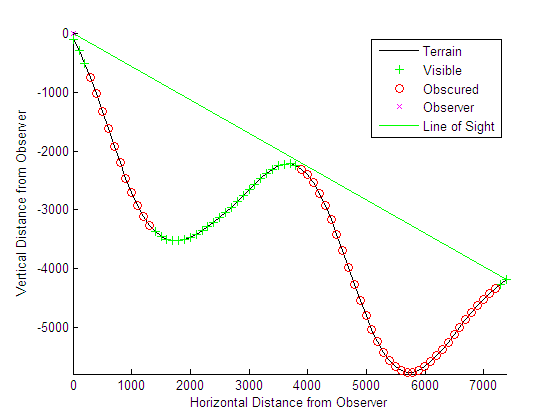
The los2 function produces a profile diagram in a figure
window showing visibility at each grid cell along the line of sight that can be used
to interpret the Boolean result. In this example, the diagram shows that the line
between the two locations just barely clears an intervening peak.
You can also compute the viewshed, a name derived from
watershed, which indicates the elements of a terrain
elevation grid that are visible from a particular location. The
viewshed function checks for a line of sight between a fixed
observer and each element in the grid. See the viewshed function reference page for an example.