Inset Maps
An inset map is a smaller map displayed inside a larger map. You can use an inset map to create geographic context for the larger map. This example shows how to create a map of Massachusetts and include an inset map of the northeastern United States.
This example shows how to create an inset map in an axesm-based map. For an example of creating inset maps in map axes, see Position Multiple Map Axes in Figure on the mapaxes reference page. For a comparison of map axes and axesm-based maps, including when to use each type of display, see Choose a 2-D Map Display.
Prepare Data
Read a shapefile of US states into the workspace as a geospatial table. The table represents the states using polygon shapes in geographic coordinates.
states = readgeotable("usastatehi.shp");Extract the table row for Massachusetts. Find the latitude and longitude limits of the Massachusetts polygon shape.
ma = geocode("Massachusetts",states);
[latlim,lonlim] = bounds(ma.Shape);
Create Map
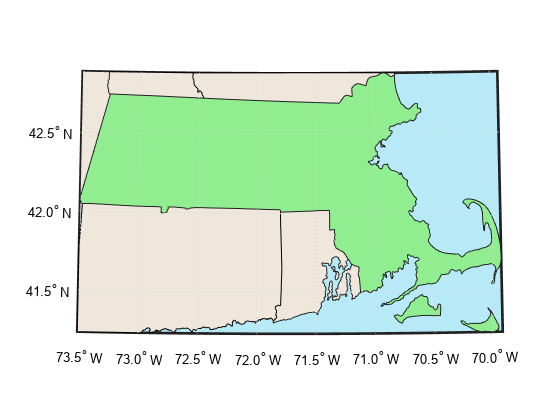
Create a map using the latitude and longitude coordinates. Set the face frame color of the map to light blue. Display the USA boundaries as light-brown polygons and the Massachusetts boundaries as green polygons.
figure
h1 = usamap(latlim,lonlim);
setm(h1,"FFaceColor","#B7E9F7")
geoshow(states,FaceColor="#EFE6DC")
geoshow(ma,FaceColor="#90EE90")
Create Inset Map
Create an inset map. To do this, first create axes in the lower-left of the map frame. Place a map with latitude and longitude limits that contain Pennsylvania and Maine inside the axes, remove the parallel and meridian labels, and remove the grid lines. Then, display the USA boundaries as gray polygons and the Massachusetts boundaries as green polygons.
h2 = axes(Position=[0.13 0.18 0.25 0.25]);
usamap(["PA","ME"])
setm(h2,"FFaceColor","w")
plabel off
mlabel off
gridm off
geoshow(states,FaceColor="#EDEDED")
geoshow(ma,FaceColor="#90EE90")

See Also
Functions
readgeotable|geocode|usamap|geoshow