Use newplot to Control Plotting
This example shows how to prepare the axes for user-written plotting functions. Use dot notation to set properties.
Use newplot to manage the output from
specialized plotting functions. The myPlot2D function:
Uses revolving line styles and a single color for multiline plots.
Adds a legend with specified display names.
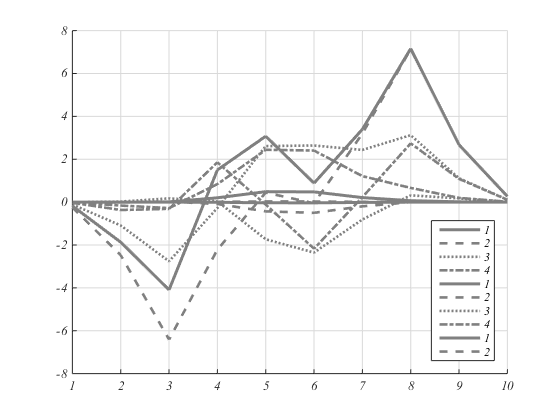
function myPlot2D(x,y)
   % Call newplot to get the axes object
   cax = newplot;
   % Customize axes
   cax.FontName = 'Times';
   cax.FontAngle = 'italic';

   % Create plot
   hLines = line(x,y,...
      'Color',[.5,.5,.5],...
      'LineWidth',2);
   lso = ['- ';'--';': ';'-.'];
   setLineStyle(hLines)
   grid on
   legend('show','Location','SouthEast')

   function setLineStyle(hLines)
      style = 1;
      for ii = 1:length(hLines)
         if style > length(lso)
            style = 1;
         end
         hLines(ii).LineStyle = lso(style,:);
         hLines(ii).DisplayName = num2str(style);
         style = style + 1;
      end
   end
end
This plot shows the typical output for the myPlot2D function:
x = 1:10;
y = peaks(10);
myPlot2D(x,y)
The myPlot2D function shows the basic structure of a user-written
plotting function:
Because myPlot2D uses the axes object returned by
newplot to access the target axes, this function:
Adheres to the behavior of MATLAB® plotting functions when clearing the axes with each subsequent call.
Works correctly when
holdis set toon.
The default settings for the NextPlot properties ensure that your
plotting functions adhere to the standard MATLAB behavior — reuse the figure window, but clear and reset the axes with
each new plot.