Main Content

inner2outer

Invert nested table-in-table hierarchy in tables or timetables

Description

example

T2 = inner2outer(T1) finds the variables in T1 that are themselves tables or timetables. It returns T2, a table or timetable that also contains nested tables or timetables as variables. The names of the variables in T2 are taken from the names of the variables inside the nested tables or timetables of T1. Then, inner2outer regroups variables in the nested tables or timetables of T2 appropriately. If T1 has variables that are not tables or timetables, then those variables are unaltered in T2.

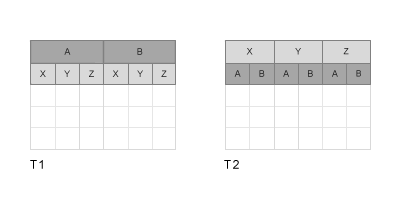
For example, if T1 has two variables named A and B, and they are each tables with variables named X, Y, and Z, then the output table T2 has three variables. The variables of T2 are named X, Y, and Z, each being a table with two variables named A and B. The table variables T1.A.X and T1.B.X are regrouped into T2.X.A and T2.X.B. The other table variables from T1 are regrouped in T2 following the same pattern.

Examples

collapse all

Load and display a timetable, T1, that has nested tables containing stock information. The nested tables AAPL and MSFT are the variables of T1. Each nested table has the stock prices at the open and close of trading, and the volume, for a different company.

load nestedTables
T1
T1 =

  3x2 timetable

       Dates                  AAPL                          MSFT           
                    Open     Close     Volume     Open     Close     Volume
    ___________    __________________________    __________________________

    01-Jan-2017    64.539    71.704    107.17    66.429     91.77      78.7
    01-Feb-2017    101.53    87.619    57.909    72.984    84.629    57.959
    01-Mar-2017    60.381    76.464    72.067    78.127    76.492    82.883

To group the Open, Close, and Volume variables together in nested tables of their own, use the inner2outer function.

T2 = inner2outer(T1)
T2 =

  3x3 timetable

       Dates             Open               Close               Volume     
                    AAPL      MSFT      AAPL      MSFT      AAPL      MSFT 
    ___________    ________________    ________________    ________________

    01-Jan-2017    64.539    66.429    71.704     91.77    107.17      78.7
    01-Feb-2017    101.53    72.984    87.619    84.629    57.909    57.959
    01-Mar-2017    60.381    78.127    76.464    76.492    72.067    82.883

Some calculations are more convenient with data from each stock grouped in the nested tables of T2. For example, you can calculate the normalized volume for all stocks using T2.Volume.

Use the Variables property of T2 to convert T2.Volume into a matrix. Then subtract the mean of T2.Volume from T2.Volume and return the result as a matrix.

normVolume = T2.Volume.Variables - mean(T2.Volume.Variables)
normVolume =

   28.1213    5.5193
  -21.1397  -15.2217
   -6.9817    9.7023

You also can use table functions on the nested tables. Calculate the mean closing price of all stocks using the varfun function, returning the means in a table.

meanClose = varfun(@mean,T2.Close)
meanClose =

  1x2 table

    mean_AAPL    mean_MSFT
    _________    _________

     78.596       84.297  

Input Arguments

collapse all

Input table, specified as a table or timetable.

Extended Capabilities

Version History

Introduced in R2018a