Design MPC Controller for Position Servomechanism
This example shows how to design a model predictive controller for a position servomechanism using MPC Designer.
System Model
A position servomechanism consists of a DC motor, gearbox, elastic shaft, and load.

The differential equations representing this system are
where,
V is the applied voltage.
T is the torque acting on the load.
is the load angular velocity.
is the motor shaft angular velocity.
The remaining terms are constant parameters.
Constant Parameters for Servomechanism Model
Symbol | Value (SI Units) | Definition |
|---|---|---|
| kT | 1280.2 | Torsional rigidity |
| kM | 10 | Motor constant |
| JM | 0.5 | Motor inertia |
| JL | 50JM | Load inertia |
| ρ | 20 | Gear ratio |
| βM | 0.1 | Motor viscous friction coefficient |
| βL | 25 | Load viscous friction coefficient |
| R | 20 | Armature resistance |
If you define the state variables as
then you can model the servomechanism as an LTI state-space system.
The controller must set the angular position of the load, θL, at a desired value by adjusting the applied voltage, V.
However, since the elastic shaft has a finite shear strength, the torque, T, must stay within the range |T| ≤ 78.5 Nm. Also, the voltage source physically limits the applied voltage to the range |V| ≤ 220 V.
Construct Plant Model
Specify the model constants (units are in MKS).
Kt = 1280.2;  % Torsional rigidity
Km = 10;      % Motor constant
Jm = 0.5;     % Motor inertia
Jl = 50*Jm;   % Load inertia
N = 20;       % Gear ratio
Bm = 0.1;     % Rotor viscous friction
Bl = 25;      % Load viscous friction
R = 20;       % Armature resistance
Define the state-space matrices derived from the model equations.
A = [        0       1             0                0;
        -Kt/Jl  -Bl/Jl     Kt/(N*Jl)                0;
             0       0             0                1;
     Kt/(Jm*N)       0  -Kt/(Jm*N^2)  -(Bm+Km^2/R)/Jm];
B = [0; 0; 0; Km/(R*Jm)];
C = [  1  0       0  0;
      Kt  0   -Kt/N  0];
D = [0; 0];
Create a state-space model.
plant = ss(A,B,C,D);
Open MPC Designer App
mpcDesigner
Import Plant and Define Signal Configuration
In MPC Designer, on the MPC Designer tab, select MPC Structure.
In the Define MPC Structure By Importing dialog box, select the
plant plant model, and assign the plant I/O channels to the following
signal types:
Manipulated variable — Voltage, V
Measured output — Load angular position, θL
Unmeasured output — Torque, T
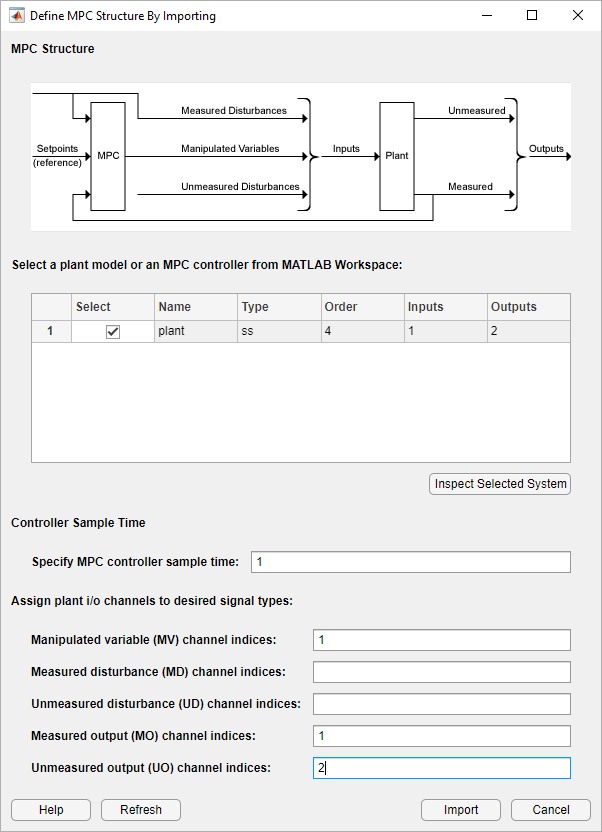
Click Import.
MPC Designer imports the specified plant and creates an MPC controller and a simulation scenario:
mpc1— Default MPC controller created usingplantas its internal model.scenario1— Default simulation scenario. The results of this simulation are displayed in the Input Response and Output Response plots.
Plants, controllers and simulation scenarios are accessible via the data browser, on the left hand side of MPC Designer.
Define Input and Output Channel Attributes
On the MPC Designer tab, in the Structure section, click I/O Attributes.
In the Input and Output Channel Specifications dialog box, for each input and output channel:
Specify a meaningful Name and Unit.
Keep the Nominal Value at its default value of
0.Specify a Scale Factor for normalizing the signal. Select a value that approximates the predicted operating range of the signal:
Channel Name Minimum Value Maximum Value Scale Factor Voltage–220 V 220 V 440Theta–π radians π radians 6.28Torque–78.5 Nm 78.5 Nm 157

Click OK to update the channel attributes and close the dialog box.
Modify Scenario to Simulate Angular Position Step Response
In the Scenario section, Edit Scenario
drop-down list, select scenario1 to modify the default
simulation scenario.
In the Simulation Scenario dialog box, keep a Simulation duration
of 10 seconds.
In the Reference Signals table, keep the default configuration
for the first channel. These settings create a Step change of
1 radian in the angular position setpoint at a
Time of 1 second.
For the second output, in the Signal drop-down list, select
Constant to keep the torque setpoint at its nominal
value.
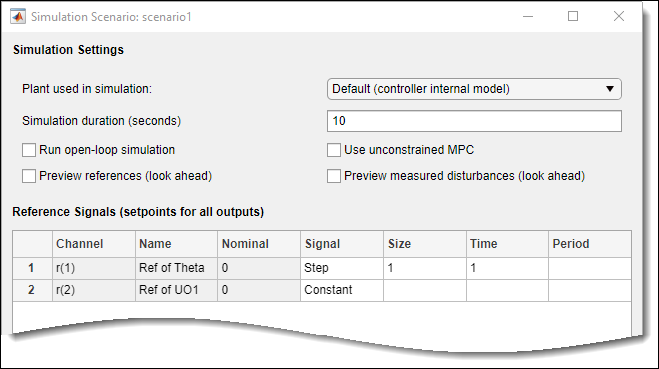
Click OK.
The app runs the simulation with the new scenario settings and updates the Input Response and Output Response plots.

Specify Controller Sample Time and Horizons
On the Tuning tab, in the Horizon section,
specify a Sample time of 0.1 seconds.
For the specified sample time, Ts, and a desired response time of Tr = 2 seconds, select a prediction horizon, p, such that:
Therefore, specify a Prediction horizon of
20.
Specify a Control horizon of 5.
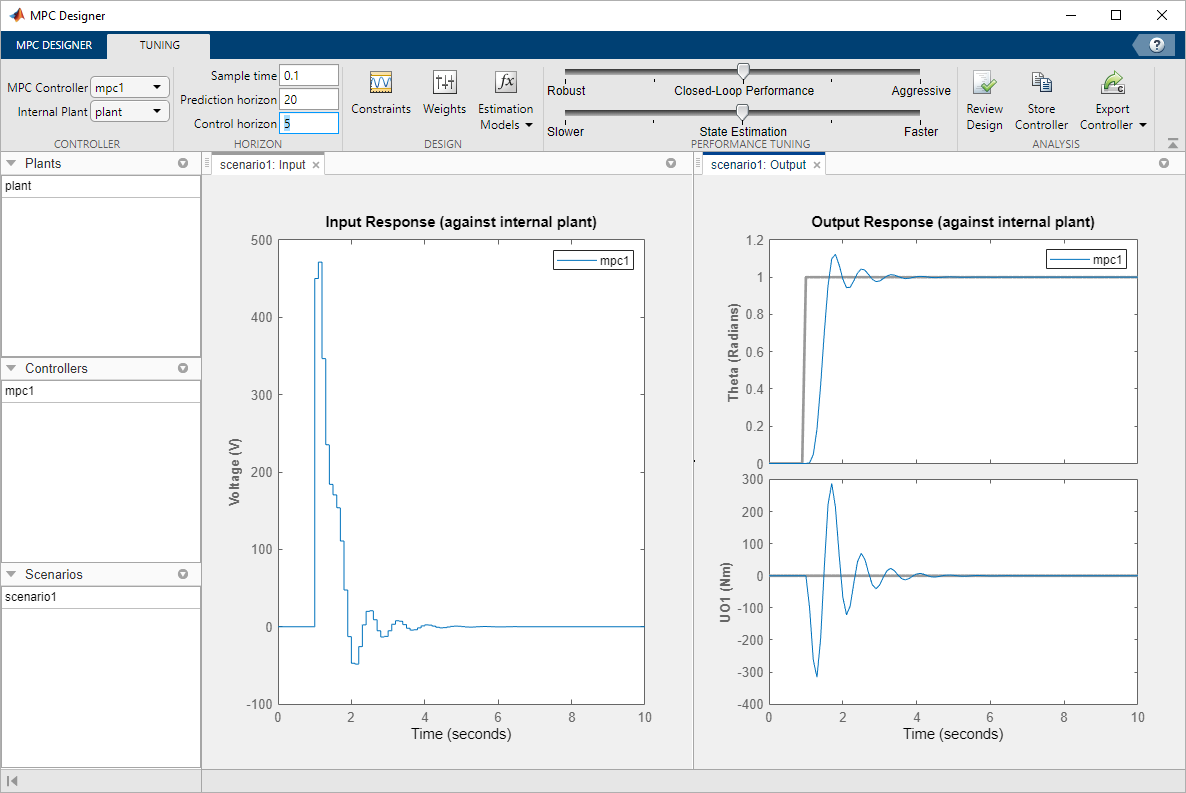
As you update the sample time and horizon values, the Input Response and Output Response plots update automatically. Both the input voltage and torque values exceed the constraints defined in the system model specifications.
Specify Constraints
In the Design section, select Constraints.
In the Constraints dialog box, in the Input Constraints section, specify the Min and Max voltage values for the manipulated variable (MV).
In the Output Constraints section, specify Min and Max torque values for the unmeasured output (UO).
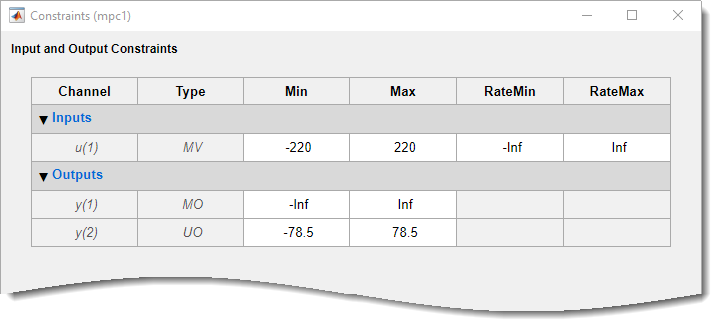
There are no additional constraints, that is the other constraints remain at their
default maximum and minimum values, —Inf and
Inf respectively.
Click OK.
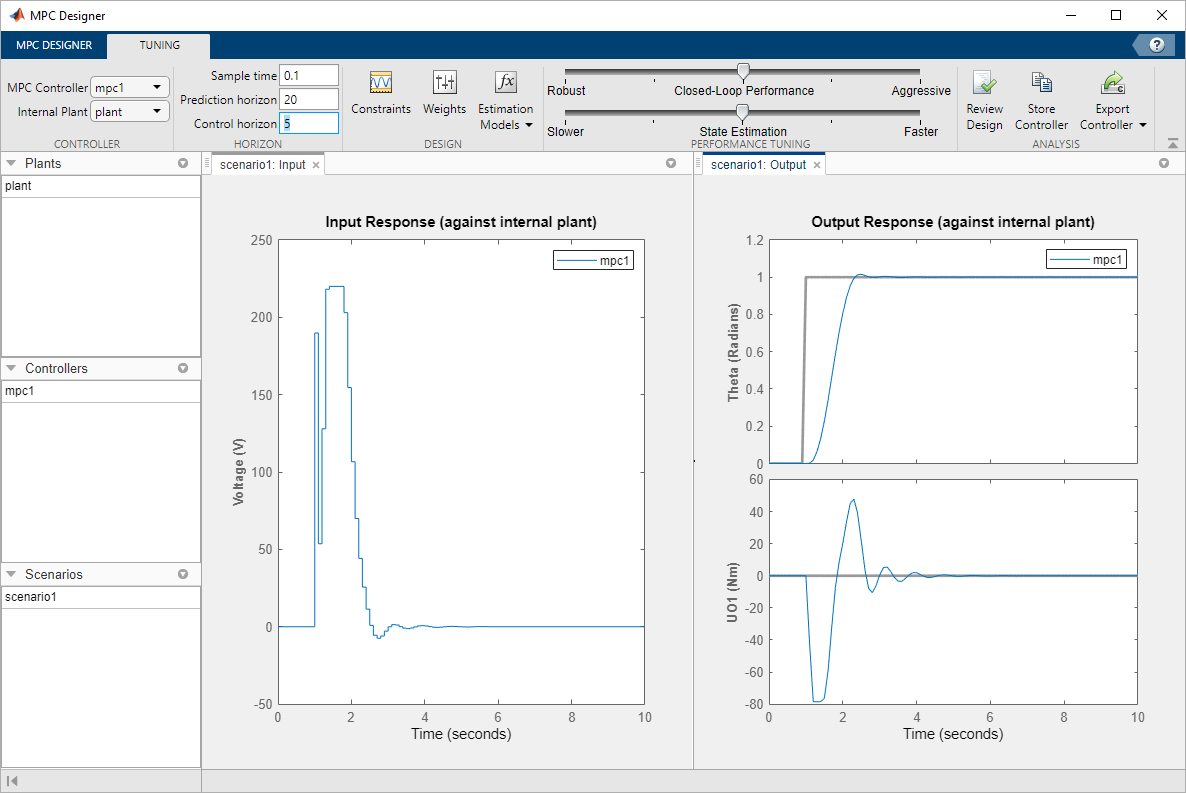
The response plots update to reflect the new constraints. In the Input Response plot, there are undesirable large changes in the input voltage.
Specify Tuning Weights
In the Design section, select Weights.
In the Weights dialog box, in the Input Weights table, increase the manipulated variable Rate Weight.
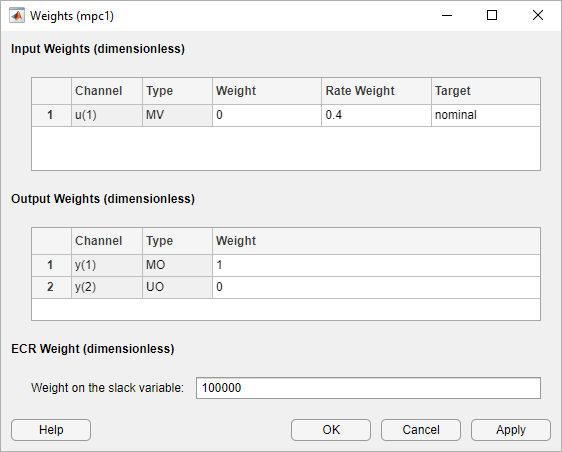
The tuning Weight for the manipulated variable (MV) is
0. This weight indicates that the controller can allow the input
voltage to vary within its constrained range. The increased Rate
Weight limits the size of manipulated variable changes.
Since the control objective is for the angular position of the load to track its
setpoint, the tuning Weight on the measured output is
1. There is no setpoint for the applied torque, so the controller can
allow the second output to vary within its constraints. Therefore, the
Weight on the unmeasured output (UO) is 0, which
enables the controller to ignore the torque setpoint.
Click OK.
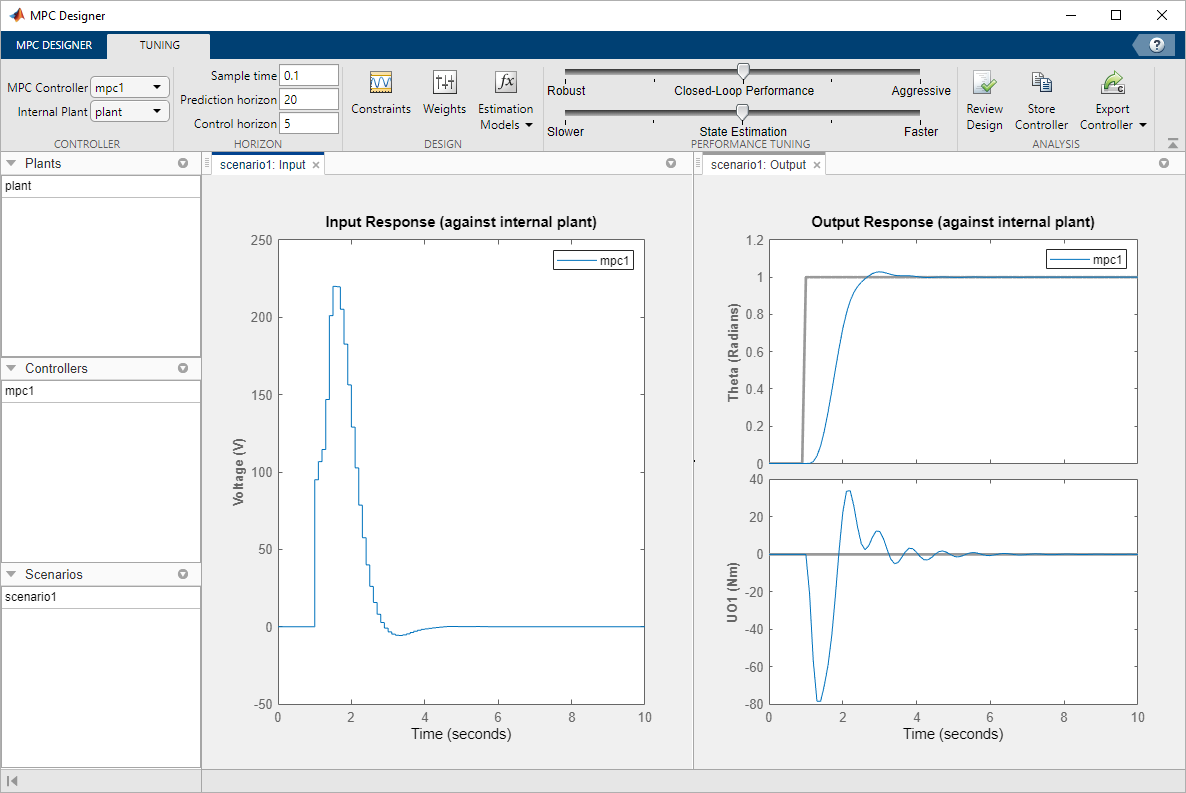
The response plots update to reflect the increased rate weight. The Input Response is smoother with smaller voltage changes.
Examine Output Response
In the Output Response plot, right-click the Theta plot area, and select Characteristics > Peak Response.

The peak output response occurs at time of 3 seconds with a maximum overshoot of 3%. Since the reference signal step change is at 1 second, the controller has a peak time of 2 seconds.
Improve Controller Response Time
Click and drag the Closed-Loop Performance slider to the right to produce a more Aggressive response. The further you drag the slider to the right, the faster the controller responds. Select a slider position such that the peak response occurs at 2.6 seconds.
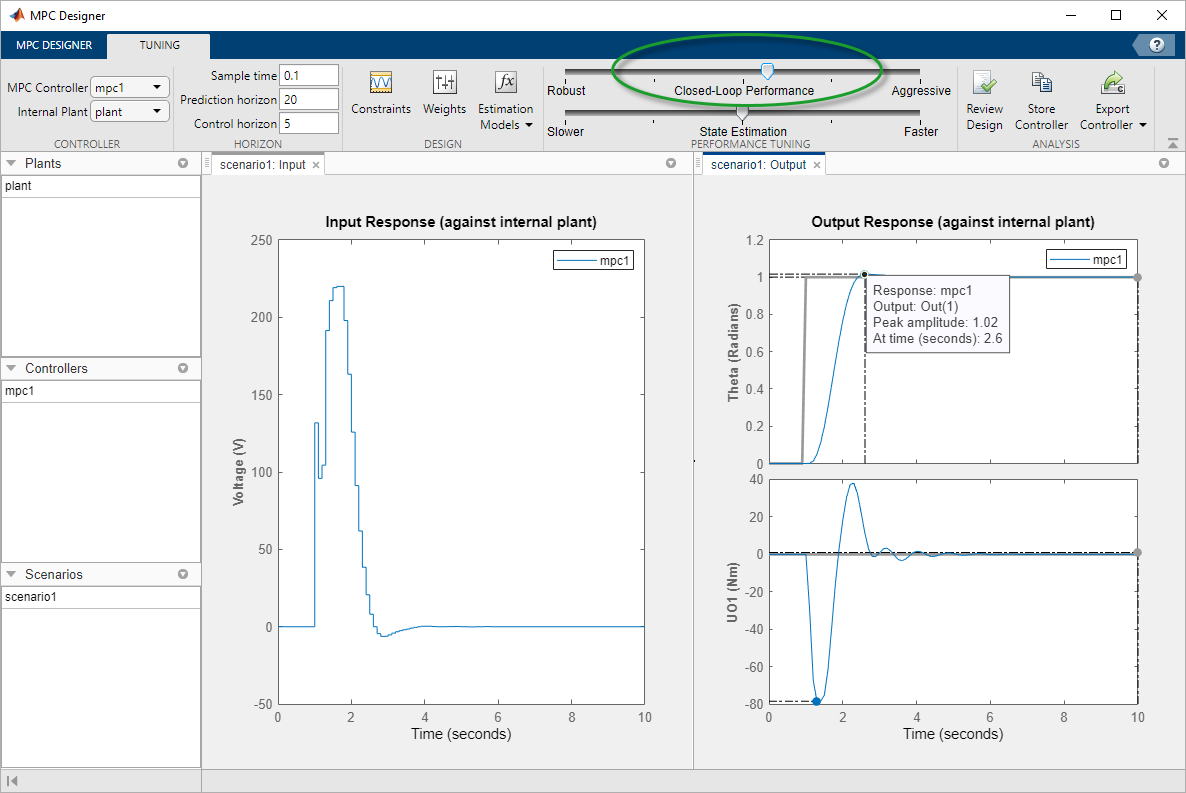
The final controller peak time is 1.6 seconds. Reducing the response time further results in overly-aggressive input voltage changes.
Generate and Run MATLAB Script
In the Analysis section, click the Export
Controller arrow ![]() .
.
Under Export Controller, click Generate
Script.
In the Generate MATLAB® Script dialog box, check the box next to
scenario1.
Click Generate Script.
The app exports a copy of the plant model, plant_C, to the
MATLAB workspace, along with simulation input and reference signals.
Additionally, the app generates the following code in the MATLAB Editor.
%% create MPC controller object with sample time
mpc1 = mpc(plant_C, 0.1);
%% specify prediction horizon
mpc1.PredictionHorizon = 20;
%% specify control horizon
mpc1.ControlHorizon = 5;
%% specify nominal values for inputs and outputs
mpc1.Model.Nominal.U = 0;
mpc1.Model.Nominal.Y = [0;0];
%% specify scale factors for inputs and outputs
mpc1.MV(1).ScaleFactor = 440;
mpc1.OV(1).ScaleFactor = 6.28;
mpc1.OV(2).ScaleFactor = 157;
%% specify constraints for MV and MV Rate
mpc1.MV(1).Min = -220;
mpc1.MV(1).Max = 220;
%% specify constraints for OV
mpc1.OV(2).Min = -78.5;
mpc1.OV(2).Max = 78.5;
%% specify overall adjustment factor applied to weights
beta = 1.2712;
%% specify weights
mpc1.Weights.MV = 0*beta;
mpc1.Weights.MVRate = 0.4/beta;
mpc1.Weights.OV = [1 0]*beta;
mpc1.Weights.ECR = 100000;
%% specify simulation options
options = mpcsimopt();
options.RefLookAhead = 'off';
options.MDLookAhead = 'off';
options.Constraints = 'on';
options.OpenLoop = 'off';
%% run simulation
sim(mpc1, 101, mpc1_RefSignal, mpc1_MDSignal, options);
In the MATLAB Window, in the Editor tab, select Save.
Complete the Save dialog box and then click Save.
In the Editor tab, click Run.
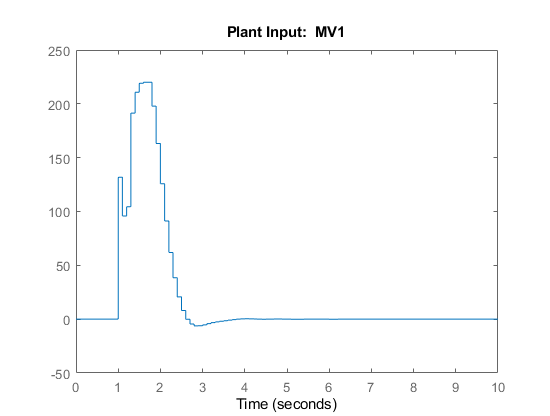

The script creates the controller, mpc1, and runs the simulation
scenario. The input and output responses match the simulation results from the app.
Validate Controller Performance In Simulink
If you have a Simulink® model of your system, you can simulate your controller and validate its performance.
Open the model.
open_system('mpc_motor')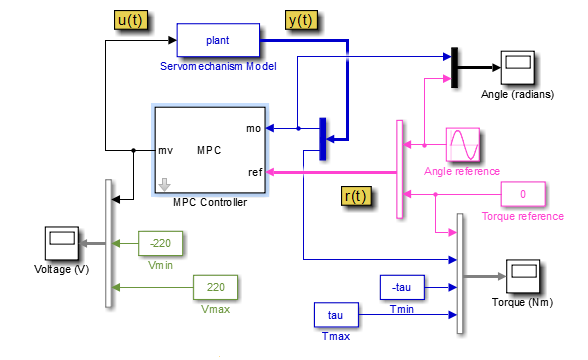
This model uses an MPC Controller block to control a servomechanism
plant. The Servomechanism Model block is already configured to use the
plant model from the MATLAB workspace.
The Angle reference source block creates a sinusoidal reference signal
with a frequency of 0.4 rad/sec and an amplitude of
π.
Double-click the MPC Controller block.
In the MPC Controller Block Parameters dialog box, specify an MPC
Controller from the MATLAB workspace. Use the mpc1 controller created using the
generated script.

Click OK.
At the MATLAB command line, specify a torque magnitude constraint variable.
tau = 78.5;
The model uses this value to plot the constraint limits on the torque output scope.
In the Simulink model window, click Run to simulate the model.
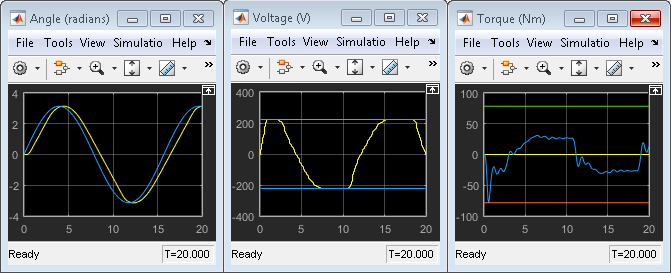
In the Angle scope, the output response, yellow, tracks the angular position setpoint, blue, closely.
See Also
Apps
Objects
Blocks
Topics
- Design Controller Using MPC Designer
- DC Servomotor with Constraint on Unmeasured Output
- Explicit MPC Control of DC Servomotor with Constraint on Unmeasured Output