Simulate Inertial Sensor Readings from a Driving Scenario
Generate synthetic sensor data from IMU, GPS, and wheel encoders using driving scenario generation tools from Automated Driving Toolbox™. The drivingScenario object simulates the driving scenario and sensor data is generated from the imuSensor, gpsSensor, and wheelEncoderAckermann objects.
Define Scenario
Create a driving scenario with one vehicle. Define waypoints to have the vehicle move forward and make a turn. To simulate GPS readings, specify the reference location in geodetic coordinates. Generate the vehicle trajectory with the smoothTrajectory object function. Plot the waypoints.
lla0 = [42 -71 50];
s = drivingScenario('GeoReference',lla0);
v = vehicle(s);

waypoints = [-11 -0.25 0;
    -1 -0.25 0;
    -0.6 -0.4 0;
    -0.6 -9.3 0];
speed = [1.5;0;0.5;1.5];
smoothTrajectory(v,waypoints,speed);

figure
plot(waypoints(:,1),waypoints(:,2),'-o')
xlabel('X (m)')
ylabel('Y (m)')
title('Vehicle Position Waypoints')

Create Sensors
Create the IMU, GPS, and wheel encoder sensors. Specify the offset location and angles of the IMU and GPS. These can be edited to change the mounting position and orientation of the sensors on the vehicle.
mountingLocationIMU = [1 2 3];
mountingAnglesIMU = [0 0 0];
% Convert orientation offset from Euler angles to quaternion.
orientVeh2IMU = quaternion(mountingAnglesIMU,'eulerd','ZYX','frame');
% ReferenceFrame must be specified as ENU.
imu = imuSensor('SampleRate',1/s.SampleTime,'ReferenceFrame','ENU');

mountingLocationGPS = [1 2 3];
mountingAnglesGPS = [50 40 30];
% Convert orientation offset from Euler angles to quaternion.
orientVeh2GPS = quaternion(mountingAnglesGPS,'eulerd','ZYX','frame');
% The GeoReference property in drivingScenario is equivalent to
% the ReferenceLocation property in gpsSensor.
% ReferenceFrame must be specified as ENU.
gps = gpsSensor('ReferenceLocation',lla0,'ReferenceFrame','ENU');

encoder = wheelEncoderAckermann('TrackWidth',v.Width,...
    'WheelBase',v.Wheelbase,'SampleRate',1/s.SampleTime);
Run Simulation
Run the simulation and log the generated sensor readings.
% IMU readings.
accel = [];
gyro = [];
% Wheel encoder readings.
ticks = [];
% GPS readings.
lla = [];
gpsVel = [];
% Define the rate of the GPS compared to the simulation rate.
simSamplesPerGPS = (1/s.SampleTime)/gps.SampleRate;
idx = 0;
while advance(s)
    groundTruth = state(v);

    % Unpack the ground truth struct by converting the orientations from
    % Euler angles to quaternions and converting angular velocities form
    % degrees per second to radians per second.
    posVeh = groundTruth.Position;
    orientVeh = quaternion(fliplr(groundTruth.Orientation), 'eulerd', 'ZYX', 'frame');
    velVeh = groundTruth.Velocity;
    accVeh = groundTruth.Acceleration;
    angvelVeh = deg2rad(groundTruth.AngularVelocity);

    % Convert motion quantities from vehicle frame to IMU frame.
    [posIMU,orientIMU,velIMU,accIMU,angvelIMU] = transformMotion( ...
        mountingLocationIMU,orientVeh2IMU, ...
        posVeh,orientVeh,velVeh,accVeh,angvelVeh);
    [accel(end+1,:), gyro(end+1,:)] = imu(accIMU,angvelIMU,orientIMU);

    ticks(end+1,:) = encoder(velVeh, angvelVeh, orientVeh);

    % Only generate a new GPS sample when the simulation has advanced
    % enough.
    if (mod(idx, simSamplesPerGPS) == 0)
        % Convert motion quantities from vehicle frame to GPS frame.
        [posGPS,orientGPS,velGPS,accGPS,angvelGPS] = transformMotion(...
            mountingLocationGPS, orientVeh2GPS,...
            posVeh,orientVeh,velVeh,accVeh,angvelVeh);
        [lla(end+1,:), gpsVel(end+1,:)] = gps(posGPS,velGPS);
    end
    idx = idx + 1;
end
Visualize Results
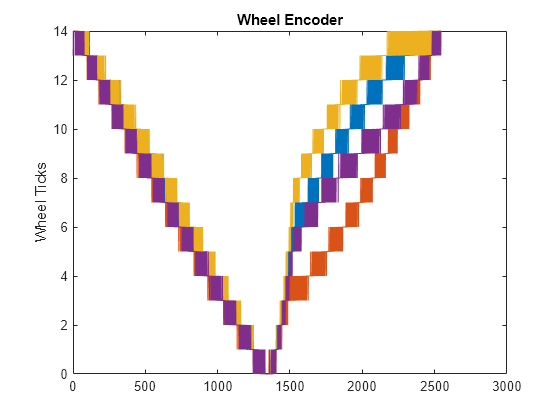
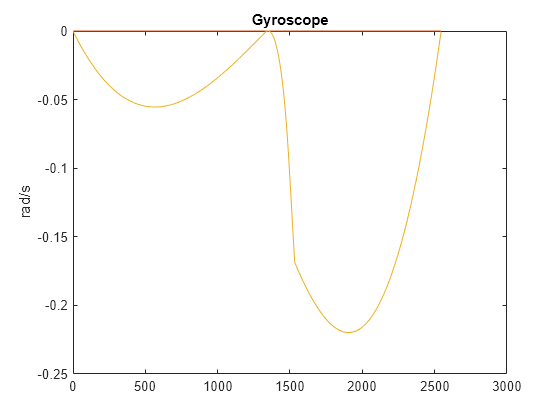
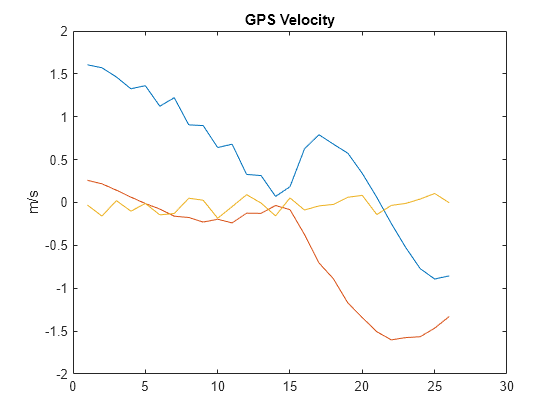
Plot the generated sensor readings.
figure
plot(ticks)
ylabel('Wheel Ticks')
title('Wheel Encoder')

figure
plot(accel)
ylabel('m/s^2')
title('Accelerometer')

figure
plot(gyro)
ylabel('rad/s')
title('Gyroscope')

figure
geoplot(lla(:,1),lla(:,2))
title('GPS Position')
figure
plot(gpsVel)
ylabel('m/s')
title('GPS Velocity')
