step
System object: phased.MUSICEstimator
Namespace: phased
Estimate direction of arrival using MUSIC
Syntax
spectrum = step(estimator,X)

[spectrum,doa]
= step(estimator,X)
Description
Note
Instead of using the step method to perform
the operation defined by the System object™, you can call the object
with arguments, as if it were a function. For example, y
= step(obj,x) and y = obj(x) perform
equivalent operations.
spectrum = step(estimator,X)X.
[
also returns the signal broadside directions of arrival, spectrum,doa]
= step(estimator,X)doa. To use
this syntax, set the DOAOutputPort property to
true.
Note
The object performs an initialization the first time the object is executed. This
initialization locks nontunable properties
and input specifications, such as dimensions, complexity, and data type of the input data.
If you change a nontunable property or an input specification, the System object issues an error. To change nontunable properties or inputs, you must first
call the release method to unlock the object.
Input Arguments
Output Arguments
Examples
Estimate the DOAs of two signals received by a standard 10-element ULA having an element spacing of 1 meter. Then plot the MUSIC spectrum.
Create a ULA array object. The antenna operating frequency is 150 MHz.
fc = 150.0e6;
array = phased.ULA(NumElements=10,ElementSpacing=1.0);
Create the arriving signals at the ULA. The true direction of arrival of the first signal is 10° in azimuth and 20° in elevation. The direction of the second signal is 60° in azimuth and -5° in elevation.
fs = 8000.0;
t = (0:1/fs:1).';
sig1 = cos(2*pi*t*300.0);
sig2 = cos(2*pi*t*400.0);
sig = collectPlaneWave(array,[sig1 sig2],[10 20; 60 -5]',fc);
noise = 0.1*(randn(size(sig)) + 1i*randn(size(sig)));
Estimate the DOAs.
estimator = phased.MUSICEstimator(SensorArray=array,...
    OperatingFrequency=fc,...
    DOAOutputPort=true,NumSignalsSource="Property",...
    NumSignals=2);
[y,doas] = estimator(sig + noise);
doas = broadside2az(sort(doas),[20 -5])
doas = 1×2

    9.5829   60.3813
Plot the MUSIC spectrum.
plotSpectrum(estimator,"NormalizeResponse",true)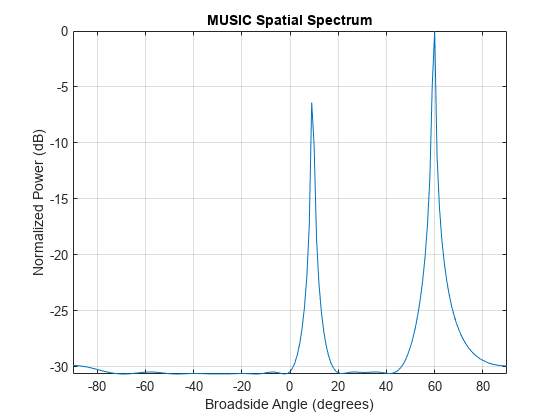
First, estimate the DOAs of two signals received by a standard 10-element ULA having an element spacing of one-half wavelength.Then, plot the spatial spectrum.
The antenna operating frequency is 150 MHz. The arrival directions of the two signals are separated by 2°. The direction of the first signal is 30° azimuth and 0° elevation. The direction of the second signal is 32° azimuth and 0° elevation. Estimate the number of signals using the Minimum Description Length (MDL) criterion.
Create the signals arriving at the ULA.
fs = 8000;
t = (0:1/fs:1).';
f1 = 300.0;
f2 = 600.0;
sig1 = cos(2*pi*t*f1);
sig2 = cos(2*pi*t*f2);
fc = 150.0e6;
c = physconst('LightSpeed');
lam = c/fc;
array = phased.ULA('NumElements',10,'ElementSpacing',0.5*lam);
sig = collectPlaneWave(array,[sig1 sig2],[30 0; 32 0]',fc);
noise = 0.1*(randn(size(sig)) + 1i*randn(size(sig)));
Estimate the DOAs.
estimator = phased.MUSICEstimator('SensorArray',array,...
    'OperatingFrequency',fc,'DOAOutputPort',true,...
    'NumSignalsSource','Auto','NumSignalsMethod','MDL');
[y,doas] = estimator(sig + noise);
doas = broadside2az(sort(doas),[0 0])
doas = 1×2

   30.0000   32.0000
Plot the MUSIC spectrum.
plotSpectrum(estimator,'NormalizeResponse',true)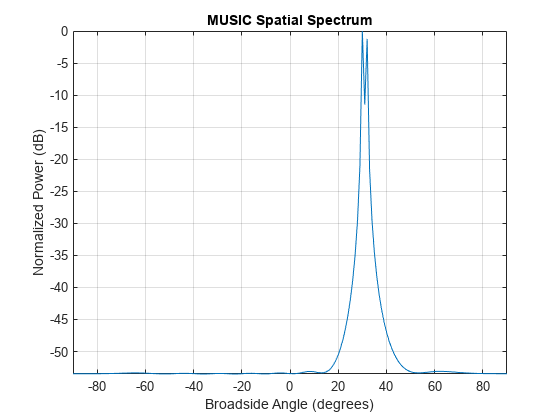
Version History
Introduced in R2016b