Merge Coverage Results from Simulink Coverage and Polyspace Test
Your code base can include MATLAB® code, C/C++ code generated from Simulink® models, and hand-written C/C++ code. You can gather code coverage of these components and then review all coverage results together in the Polyspace Platform user interface. In this way, you can track the coverage of both generated code and hand-written code in the same dashboard.
This example shows how to gather code coverage of generated code by using Simulink Coverage™, gather code coverage of hand-written code using Polyspace® Test™, and then merge the results and review them together in Polyspace Platform user interface.
Prerequisites
Following this example requires product licenses for:
Simulink Coverage
Embedded Coder®
Polyspace Test
The source files required for this example are located in the folder polyspaceroot\polyspace\examples\doc_pstest\coverage_data_collectionpolyspacerootC:\Program Files\Polyspace\R2026a. Copy the content of this folder to a writable folder.
Gather Code Coverage of Generated Code
Open the model slvnvdemo_counter_harness in a writable location.
openExample('slcoverage/SoftwareintheLoopCodeCoverageExample')slvnvdemo_counter. The Signal Editor block Inputs provides inputs corresponding to a test case. To generate code and collect code coverage of slvnvdemo_counter
corresponding to this test case :
Select the Model block
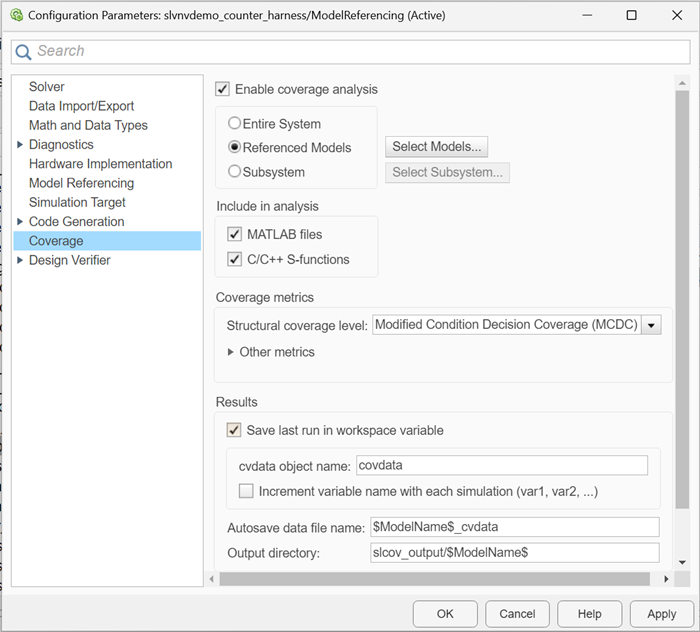
slvnvdemo_counter. In the Model Block tab, set Simulation Mode toSoftware-in-the-Loop (SIL). The corners of the block icon turn black and (SIL) appears under the model name on the block.Open the Configuration Parameters dialog box. In the Coverage pane, set these parameter:
From the Structural coverage level list, select
Modified Condition Decision Coverage (MCDC).Select Save last run in workspace variable.
Click OK to close the dialog box.
In the Apps tab, open the Coverage Analyzer app. Then, on the Coverage tab, click Analyze Coverage. Simulink Coverage generates the source file
slvnvdemo_counter.cfor the model, calculates the coverage of the source file for the test case, and saves the coverage results as the objectcovdatain the MATLAB workspace.Export the coverage results into Polyspace Test format.
The coverage results are exported in the filepstest.exportToPolyspaceProfilingResults(covdata)
output.psprof. Note the complete path of this file for later use.
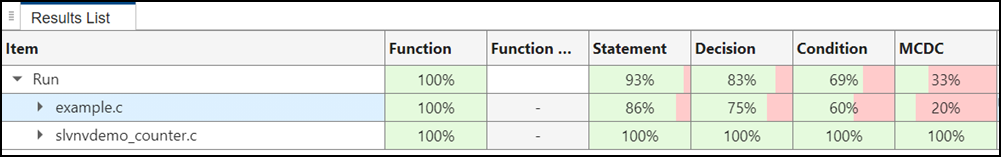
You can open this file in Polyspace Platform user interface and observe that the generated code has 100% coverage for the test case.
For more details about calculating coverage of generated code, see Code Coverage for Models in Software-in-the-Loop (SIL) Mode and Processor-in-the-Loop (PIL) Mode (Simulink Coverage).
Gather Code Coverage of Hand-Written Code
To calculate coverage for hand-written code:
In the Polyspace Platform user interface, create a new project and add the source files in the folder
coverage_data_collection/src.Click Parse Code to find the functions
foo(),bar(), andmultiply()in the source files.Add test cases for
foo(),bar(), andmultiply()by right-clicking a function and selecting Add Test Case. Add these test cases:foo(2,0)==2bar(1,1,0)==0bar(1,1,1)==1bar(1,0,1)==1bar(0,1,1)==1multiply(0,0)==0multiply(2,2)==4
In the Profiling section of the Polyspace Platform toolstrip, select Code Coverage.
Double click the Configuration node in the Projects pane. In the Testing & Profiling tab, select the Code Coverage and then from the Coverage metrics list, select
MCDC.In the Project tab, click Build Project and then click Run Tests.
Once the tests finish running, the test results and coverage results appear in the Results pane. To locate the .psprof file containing the coverage results, right-click the Coverage results and then select Show in Explorer. Note the complete path to the file ps_coverage.psprof for later use.
Merge and Review Coverage
To merge the coverage of the generated code and the hand-written code, in the system command line, enter:
polyspace-code-profiler -merge -results-dir <merged_results> -operation aggregate-variants <path_to_output.psprof> <path_to_ps_coverage.psprof>
merged_results— The folder where the merged.psproffile is stored.path_to_output.psprof— The complete path to theoutput.psproffile containing the coverage of generated code.path_to_ps_coverage.psprof— The complete path to theps_coverage.psproffile containing the coverage of the hand-written code.
To review the merged result, open the merged .psprof file in the folder merged_results using the Polyspace Platform user interface.
You can review the coverage of both generated code and handwritten code in the same interface.
See Also
pstest.exportToPolyspaceProfilingResults | polyspace-code-profiler