Structure of HTML Reports Generated from C/C++ Code Profiling Results
Using Polyspace® Test™, you can export C/C++ code coverage, execution time, or memory use results to HTML reports for archiving and certification. This topic walks through the structure of an HTML report generated from C/C++ code profiling results. The topic uses code coverage results for demonstration. You can see similar reports for execution time and memory use results.
For more information on:
Generating HTML reports from code profiling results, see Generate Reports from C/C++ Code Profiling Results.
Code coverage metrics, see Interpret Coverage Metrics
Organization of Reports
When you generate an HTML report in the user interface, the generated report opens automatically in your default web browser. To open reports outside this context, navigate to the folder where you generated the reports.
The report folder contains the following HTML files:
index.html— This file contains the code coverage summary report, which provides an overview of the coverage percentage for each source file.File-specific HTML reports containing the details of analyzed expressions per function and expression.
Code Coverage Summary Report
The code coverage summary report contains the following information.
Product and Version
The Product and Version section contains information about when the report was generated and the Polyspace Test product version that was used to generate the results and the report.
Analysis Information
The Analysis Information section contains basic information about the tests being run. It has these subsections.
File Information — Includes the last modified time, file size, and a MD5 checksum.
Project Information — Includes path to the project file, project author and creation date, and the date the project was last saved.
Environment Information — Build-specific information such as build configuration name, toolchain used for building the project, and so on.
Coverage Options — Includes all coverage options and if they were enabled or disabled for the code coverage analysis.
Aggregated Tests — List of all tests and a timestamp of when they were run.
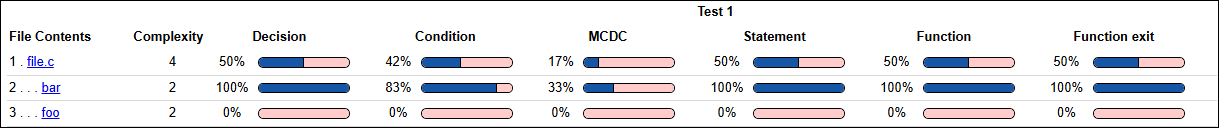
Coverage Summary
The Coverage Summary section contains information about the test results in a table format where each column represents an aspect of the test. For example, you can see that function bar() has full statement and decision coverage, but only partial condition and MC/DC coverage. Click on links in this section to navigate to further explanation in the Details section of the HTML report.
Code Coverage Detailed Report per File
The detailed code coverage report for each source file contains the following information.
Details
The Details section reports the detailed test coverage results. The HTML report highlights partial coverage in red.
For detailed explanations on the individual metrics, see Interpret Coverage Metrics.
File Details. The File section contains details about each file from the analysis. The section lists every function in the file as well as these coverage metrics:
Cyclomatic Complexity
Decision Outcomes
Condition Outcomes
MC/DC
Covered Statements
Covered Functions
Relational Boundary Coverage Outcomes (if enabled)
Function Details. The Function section is similar to the File section, but focuses on each function. Details include:
File - Which file contains the function.
Uncovered Links - Click to view the next partially covered metric.
Covered Expressions - Click to view the Decision/Condition section for the expression.
Additionally, this section shows these coverage metrics for each function.
Cyclomatic Complexity
Decision Outcomes
Condition Outcomes
MC/DC
Covered Statements
Decision/Condition. For each of the covered expressions in the function, a Decision/Condition section shows all conditions the test analyzed, as well as a MC/DC analysis showing all True Out or False Out combinations that occur during testing.
Code
The Code section of the HTML Code Coverage Summary Report shows the code analyzed as part of the test. The report highlights in red any code that does not have full coverage.