Create a Report about Magic Squares
This example shows how to create a report that explains and illustrates magic squares. Magic squares are matrices with columns, rows, and diagonals that add up to the same number. For more information, see magic.
Note: If you are using MATLAB® version R2020a or older, replace the append function calls with add.
1. Import the Report and DOM namespace so that you do not have to use fully qualified class names.
import mlreportgen.report.*
import mlreportgen.dom.*
2. Create the report object. Use "magic" as the file name and "html" as the report type. To customize properties that apply to the whole report, see mlreportgen.report.Report.
rpt = Report("magic","html");
3. Create a title page and specify the title, subtitle and author. Then, add the title page to the report. To customize additional title page properties, see mlreportgen.report.TitlePage.
tp = TitlePage;
tp.Title = "Magic Squares";
tp.Subtitle = "Columns, Rows, Diagonals: All Equal Sums";
tp.Author = "Albrecht Durer";
append(rpt,tp);
4. Add a default table of contents object to the report. To customize the table of contents, see mlreportgen.report.TableOfContents.
append(rpt,TableOfContents);
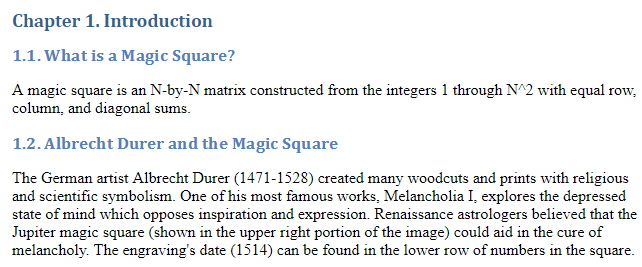
5. Create a chapter object for the introduction and specify the chapter title. Add a section, add a paragraph to that section, and add that section to the chapter. Create another section and add a paragraph to it. For information on customizing chapters and sections, see mlreportgen.report.Chapter and mlreportgen.report.Section respectively.
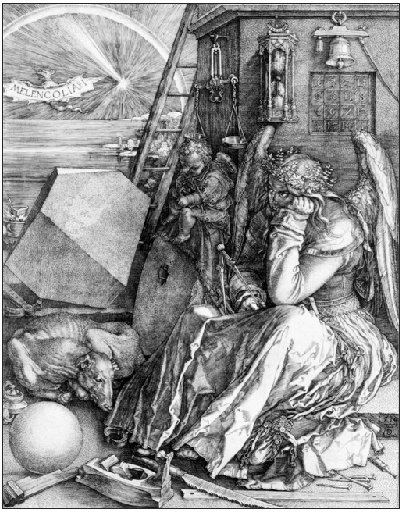
ch1 = Chapter;
ch1.Title = "Introduction";
sec1 = Section;
sec1.Title = "What is a Magic Square?";
para = Paragraph(join(["A magic square is an N-by-N matrix " ...
"constructed from the integers 1 through N^2 " ...
"with equal row, column, and diagonal sums."]));
append(sec1,para)
append(ch1,sec1)

sec2=Section;
sec2.Title = "Albrecht Durer and the Magic Square";
para = Paragraph(join([ ...
"The German artist Albrecht Durer (1471-1528) created "...
"many woodcuts and prints with religious and "...
"scientific symbolism. One of his most famous works, "...
"Melancholia I, explores the depressed state of mind "...
"which opposes inspiration and expression. "...
"Renaissance astrologers believed that the Jupiter "...
"magic square (shown in the upper right portion of "...
"the image) could aid in the cure of melancholy. The "...
"engraving's date (1514) can be found in the "...
"lower row of numbers in the square."]));
append(sec2,para)
append(ch1,sec2)
6. Create an image of Durer in a figure window. Create the image in a MATLAB figure. Add the figure to the second section of introduction chapter and then, add the chapter to the report. For more information on figures, see mlreportgen.report.Figure. For more information on images, see mlreportgen.report.FormalImage.
durerImage=load(which("durer.mat"),"-mat");
figure("Units","Pixels","Position",...
[200 200 size(durerImage.X,2)*.5 ...
size(durerImage.X,1)*.5 ]);
image(durerImage.X);
colormap(durerImage.map);
axis("image");
set(gca,"Xtick",[],"Ytick",[],...
"Units","normal","Position",[0 0 1 1]);
append(sec2,Figure)
append(rpt,ch1)
close gcf
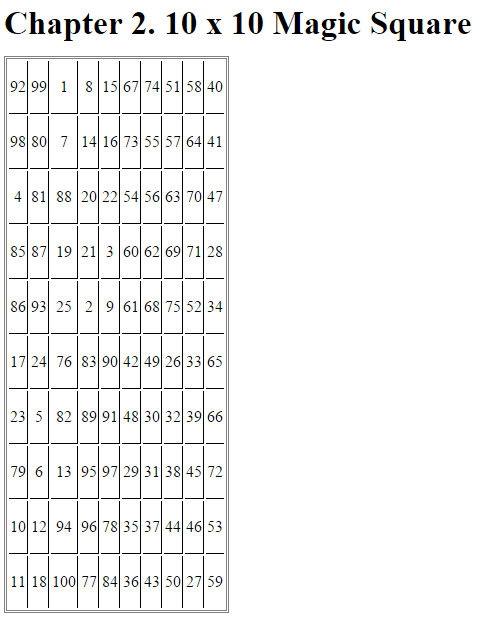
7. Add another chapter object and specify the title. Specify the MATLAB code to create a 10-by-10 magic square. Add the results to a table and set these table properties:
Row and column separators
Table border
Alignment of table entries
Then, add the table to the chapter and the chapter to the report. For more information on tables, see mlreportgen.dom.Table.
ch2 = Chapter();
ch2.Title = sprintf("10 x 10 Magic Square");
square = magic(10);
tbl = Table(square);
tbl.Style = {...
RowSep("solid","black","1px"),...
ColSep("solid","black","1px"),};
tbl.Border = "double";
tbl.TableEntriesStyle = {HAlign("center")};
append(ch2,tbl);
append(rpt,ch2);
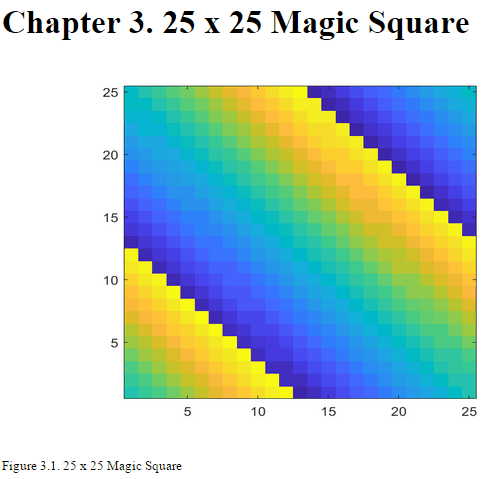
8. Add another chapter object and specify the title. Specify the MATLAB code to create a 25-by-25 magic square and a color-coded figure of the magic square. Then, create a figure object and set the height, width, and caption. Add the figure to the chapter and the chapter to the report. For more information on figures, see mlreportgen.report.Figure.
ch3 = Chapter();
ch3.Title = sprintf("25 x 25 Magic Square");
square = magic(25);
clf;
imagesc(square)
set(gca,"Ydir","normal")
axis equal
axis tight
fig = Figure(gcf);
fig.Snapshot.Height = "4in";
fig.Snapshot.Width = "6in";
fig.Snapshot.Caption = sprintf("25 x 25 Magic Square");
append(ch3,fig);
append(rpt,ch3);
delete(gcf)
9. Close and run the report.
close(rpt)
rptview(rpt)