sndr
Description
Use sndr to calculate signal to noise and distortion ratio
(SNDR) and Level Mismatch Ratio (RLM) for serial link standards such as PCIe, IEEE, and
CEI.
Creation
Description
sndr = sndr(PropertyName=Value) creates an sndr
object from the specified name-value pair arguments. You can then use the
sndr object to calculate the SNDR and RLM metrics.
Properties
Object Functions
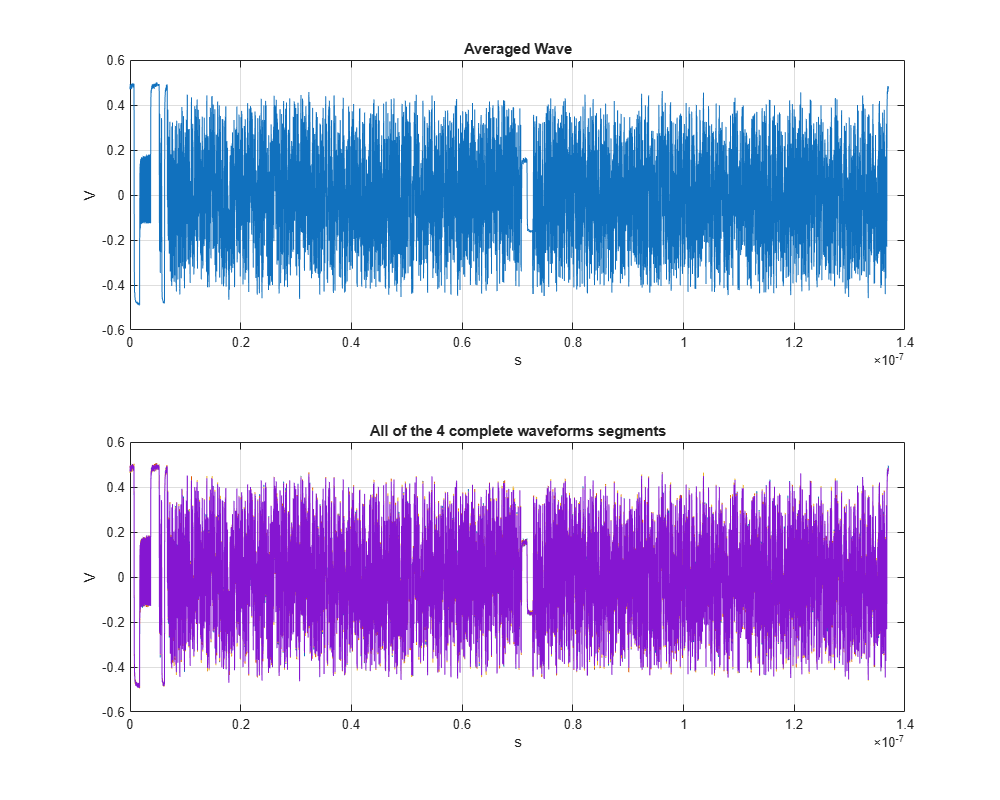
plotAveragingResults | Plot waveform averaging process results |
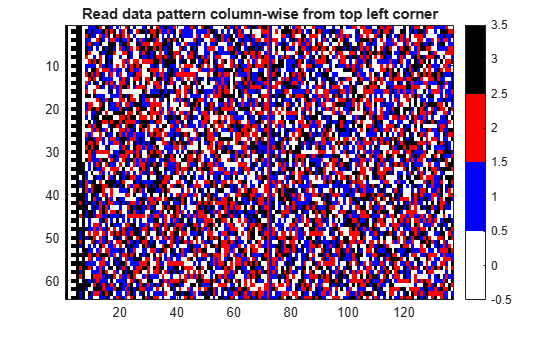
plotDataPattern | Plot data pattern |
plotLPFR | Plot linear pulse fit response results |
plotMPFR4 | Plot multiple pulse fit response PAM4 results |
plotMPFROddEven | Plot multiple pulse fit response odd/even results |
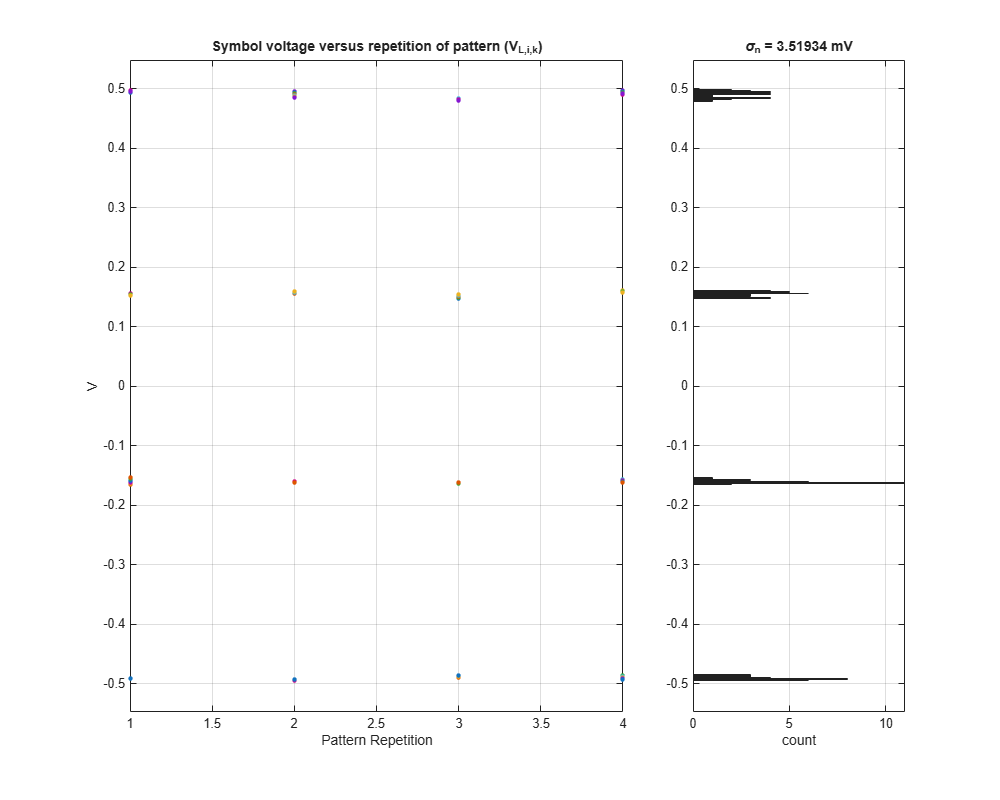
plotSigmaNoise | Plot sigma noise value against pattern repetition |
plotVLik | Plot voltages sampled from resampled wave used for noise estimation |
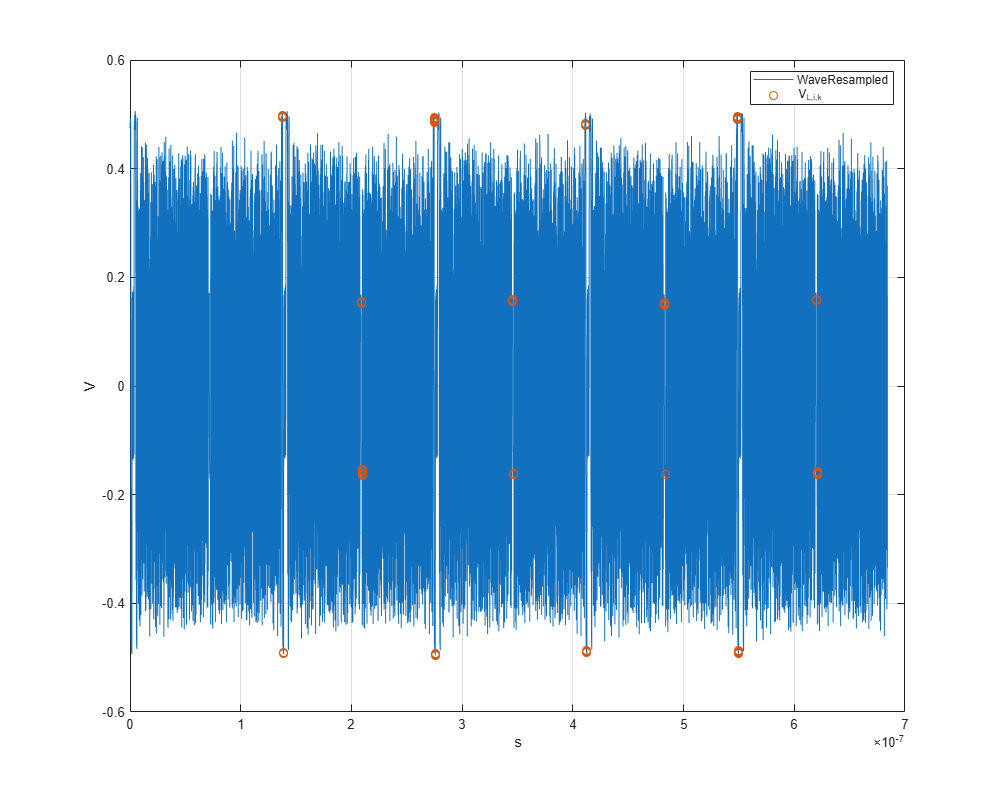
plotWaveResampled | Plot resampled waveform |
report | Report calculated SNDR and RLM for specified standard |
Examples
Load the input waveforms defined in the sndrInputs.mat file attached with this example.
load('sndrInputs.mat');Create the sndr object.
sndrObj = sndr('Wave',wave,...
    'InputSampleInterval',dt,...
    'DataPattern',DataPattern,...
    'Standard','PCIe',...
    'SymbolTime',SymbolTime);
Generate the report containing the standard name, SNDR, RLM and other metrics..
report(sndrObj)
For Standard=pcie
SNDR = 35.1892 dB
	Pmax (Effective) = 282.166 mV
	SigmaNoise = 3.51934 mV
	SigmaError = 3.42317 mV
RLM = 0.945555
	V0 = -257.083 mV
	V1 = -85.6275 mV
	V2 = +81.0286 mV
	V3 = +257.083 mV
For PCIe6 and PCIe7, the SNDR needs to be better than 34 dB and the RLM better than 0.95 for compliance.
You can plot various internal calculations required for calculating SNDR and RLM for deeper understanding.
Visualize the PCIe6/7 compliance data pattern and see that each symbol level has a run of 64 UI by observing the all black, white, red and blue columns.
plotDataPattern(sndrObj)
The waveform averaging process combines the many repetitions of the data pattern into a single waveform. This averaging reduces the random noise which can lead to a better pulse fit.
h2 = figure();
plotAveragingResults(sndrObj)
set(h2,'Units','normalized','Position',[ 0 0 1 1]);
The input waveform is resampled to sndrObj.OverSampleRatio samples per symbol (32 in this case) and analyzed to find the symbol runs of 64 UI. The 61st UI of the run is sampled to obtain VLik, which is used to determine the standard deviation of each symbol voltage and the total noise standard deviation used in the SNDR calculation. This plot identifies the VLik samples in the context of the resampled waveform.
h3 = figure();
plotWaveResampled(sndrObj)
set(h3,'Units','normalized','Position',[ 0 0 1 1]);
The VLik samples are displayed, and distribution analyzed to determine the symbol voltage standard deviations and total combined noise standard deviation, , used in the SNDR calculation.
h4 = figure();
plotSigmaNoise(sndrObj)
set(h4,'Units','normalized','Position',[0 0 1 1]);
Double check that the VLik samples are indeed extracted from the 61st UI in the run of 64 UI of each repetition of the compliance pattern as specified by PCIe7. The plot below overlays the repeated data pattern waveforms, as aligned by the 8 samples VLik. The optional second input to plotVLik specifies how many UI before and after the VLik samples to include in the plot.
h5 = figure();
plotVLik(sndrObj,4)
set(h5,'Units','normalized','Position',[0 0 1 1]);
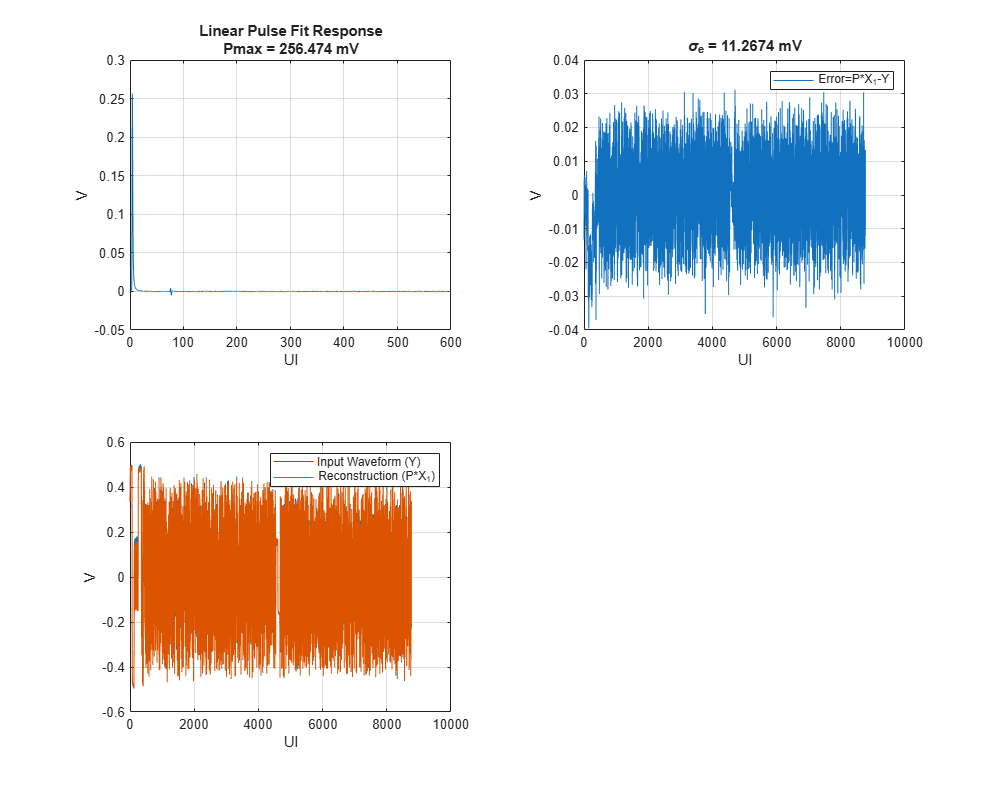
Observe the linear pulse fit response results. While the linear pulse fit is not directly used for the PCIe6 and PCIe7 SNDR calculation, the basic concept is utilized for the multiple pulse fit response (MPFR) which is used to determine the effective pulse maximum and the fit distortion noise terms of the SNDR calculation.
h6 = figure();
plotLPFR(sndrObj)
set(h6,'Units','normalized','Position',[ 0 0 1 1]);
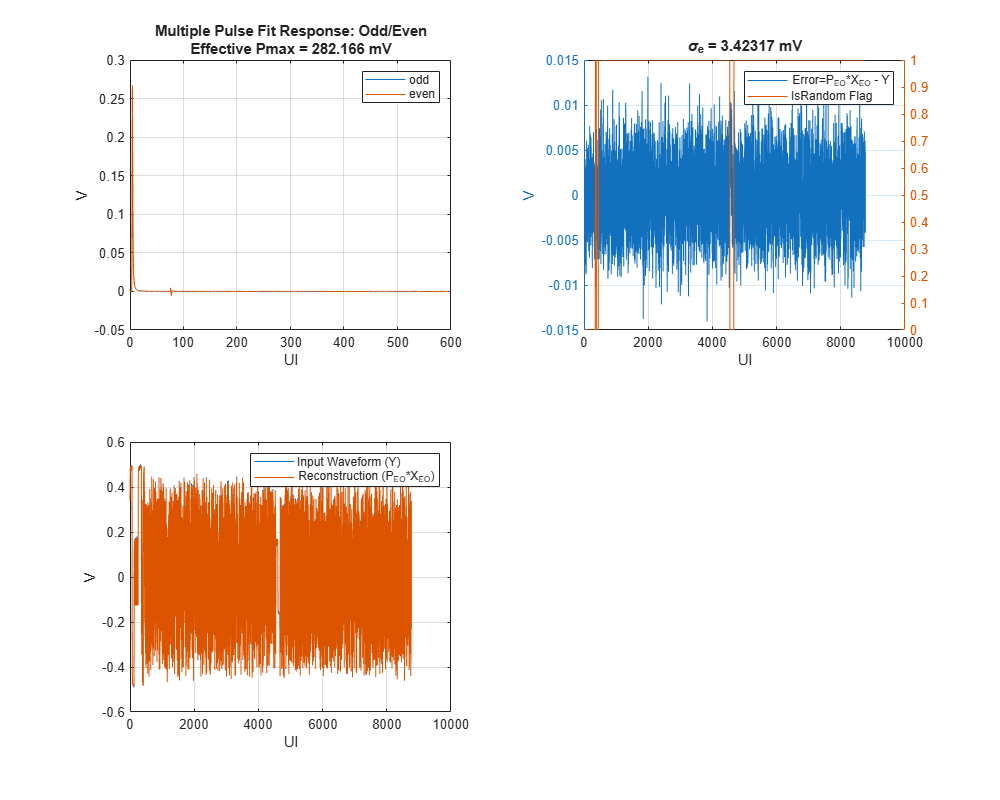
The fitted odd and even pulse responses are used to determine the effective pulse maximum and the standard deviation of the fit error (the distortion term) that goes into the SNDR calculation.
h7 = figure();
plotMPFROddEven(sndrObj)
set(h7,'Units','normalized','Position',[ 0 0 1 1]);
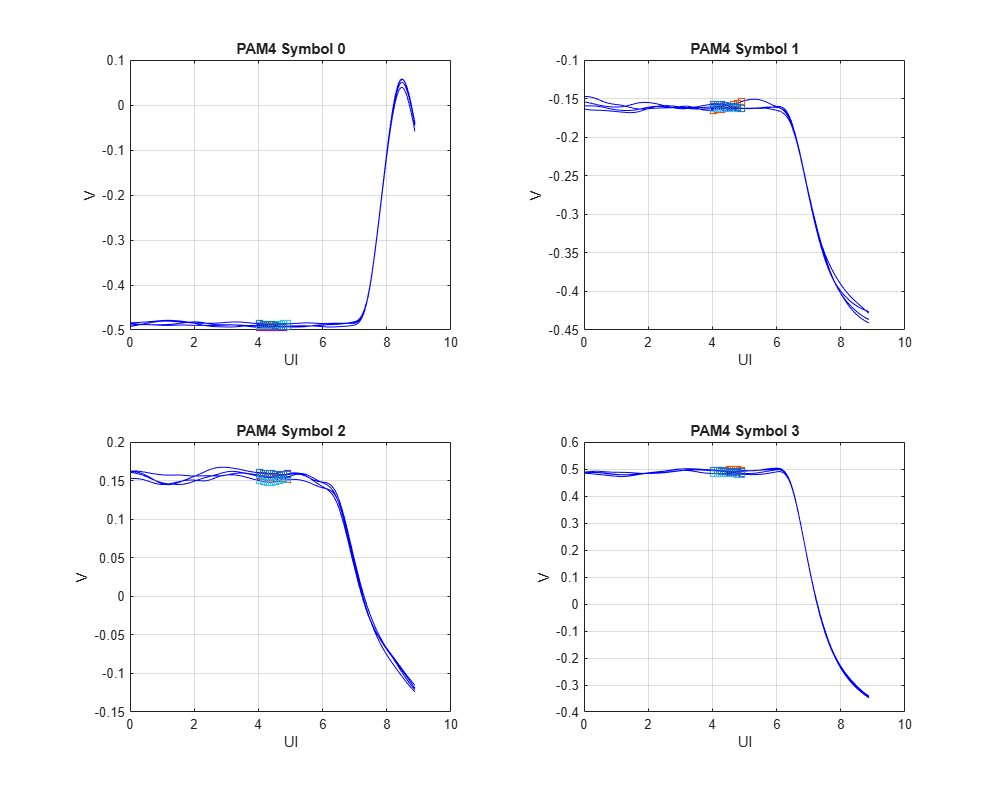
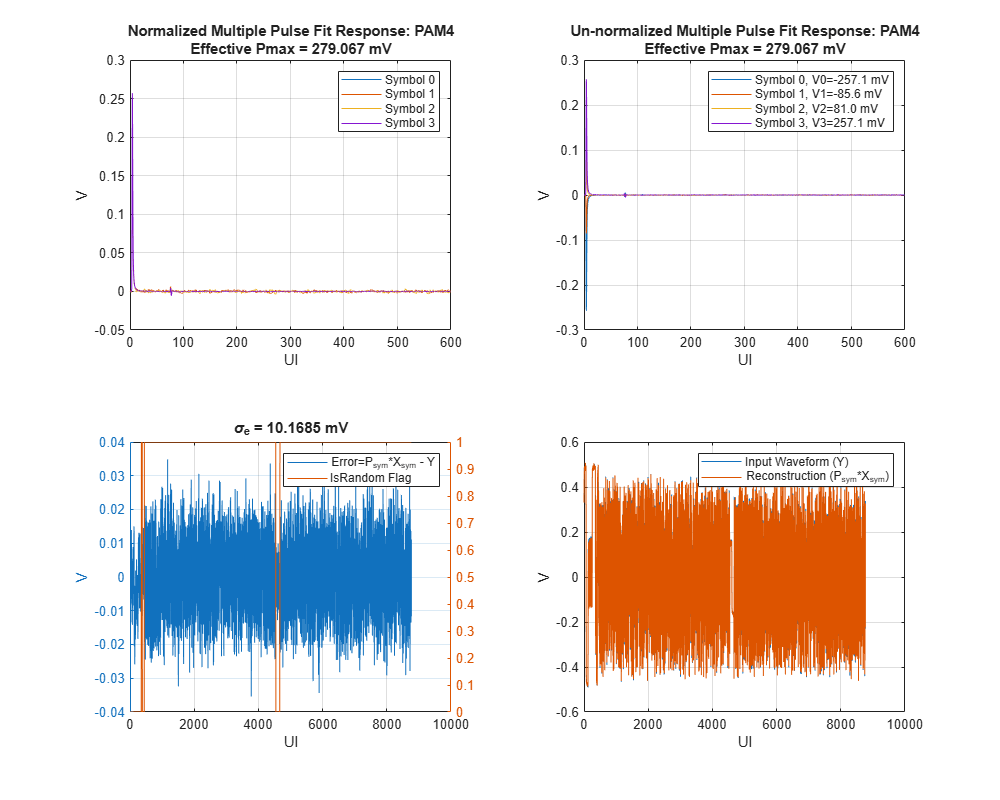
To determine the RLM, the PAM4 pulse responses are extracted from the fit. The maximum of each pulse is used in the RLM calculation. The fit error of PAM4 MPFR is not used in any calculations but included here as it may be the basis of future PAMn SNDR calculations.
h8 = figure();
plotMPFR4(sndrObj)
set(h8,'Units','normalized','Position',[ 0 0 1 1]);
Version History
Introduced in R2025a
See Also
plotAveragingResults | plotDataPattern | plotLPFR | plotMPFR4 | plotMPFROddEven | plotSigmaNoise | plotVLik | plotWaveResampled | report