Waveform Generation: Time Vectors and Sinusoids
Most toolbox functions require you to begin with a vector representing a time base. Consider generating data with a 1000 Hz sample frequency, for example. An appropriate time vector is
t = (0:0.001:1)';
where the MATLAB® colon operator (:) creates a 1001-element row vector that represents time running from 0 to 1 seconds in steps of 1 ms. The transpose operator (') changes the row vector into a column; the semicolon (;) tells MATLAB to compute, but not display, the result.
Given t, you can create a sample signal y consisting of two sinusoids, one at 50 Hz and one at 120 Hz with twice the amplitude.
y = sin(2*pi*50*t) + 2*sin(2*pi*120*t);
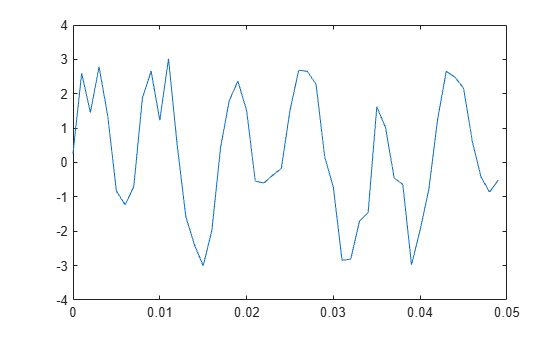
The new variable y, formed from vector t, is also 1001 elements long. You can add normally distributed white noise to the signal and plot the first 50 points:
yn = y + 0.5*randn(size(t));
plot(t(1:50),yn(1:50))