Get Started with Window Designer
Typing windowDesigner at the command line opens the Window Designer app for designing and analyzing spectral windows. The app
opens with a default 64-point Hamming window.
Note
A related tool, WVTool, is available for displaying, annotating, or printing windows.
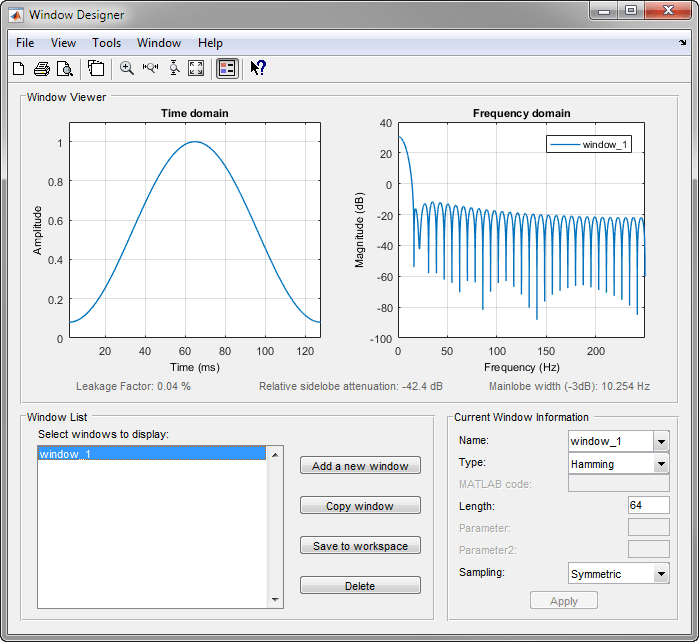
The app has three panels:
Window Viewer displays the time domain and frequency domain representations of the selected window(s). The currently active window is shown in bold. Three window measurements are shown below the plots.
Leakage factor — ratio of power in the sidelobes to the total window power
Relative sidelobe attenuation — difference in height from the mainlobe peak to the highest sidelobe peak
Mainlobe width (–3dB) — width of the mainlobe at 3 dB below the mainlobe peak
Window List lists the windows available for display in the Window Viewer. Highlight one or more windows to display them. The Window List buttons are:
Add a new window — Adds a default Hamming window with length 64 and symmetric sampling. You can change the information for this window by applying changes made in the Current Window Information panel.
Copy window — Copies the selected window(s).
Save to workspace — Saves the selected window(s) as vector(s) to the MATLAB® workspace. The name of the window is used as the vector name.
Delete — Removes the selected window(s) from the window list.
Current Window Information displays information about the currently active window. The active window name is shown in the
Namefield. To make another window active, select its name from the Name menu.
Window Parameters
Each window is defined by the parameters in the Current Window Information panel. You can change the current window's characteristics by changing its parameters and clicking Apply. The parameters of the current window are
Name — Name of the window. The name is used for the legend in the Window Viewer, in the Window List, and for the vector saved to the workspace. You can either select a name from the menu or type the desired name in the edit box.
Type — Algorithm for the window. Select the type from the menu. All Signal Processing Toolbox™ windows are available.
MATLAB code — Any valid MATLAB expression that returns a vector defining the window if
Type=User Defined.Length — Number of samples.
Parameter — Additional parameter for windows that require it, such as Chebyshev, which requires you to specify the sidelobe attenuation. Note that the title “Parameter” changes to the appropriate parameter name.
Sampling — Type of sampling to use for generalized cosine windows (Hamming, Hann, and Blackman) —
PeriodicorSymmetric.Periodiccomputes a lengthn+1window and returns the firstnpoints, andSymmetriccomputes and returns thenpoints specified inLength.
Window Designer Menus
In addition to the usual menu items, Window Designer contains these menu commands:
File menu:
Export — Exports window coefficient vectors to the MATLAB workspace, a text file, or a MAT file.
In the Window List in, highlight the window(s) you want to export and then select File > Export. For exporting to the workspace or a MAT file, specify the variable name for each set of window coefficients. To overwrite variables in the workspace, select the Overwrite variables check box.
Full View Analysis — Copies the windows shown in both plots to a separate WVTool figure window. This is useful for printing and annotating. This option is also available with the Full View Analysis toolbar button.
View menu:
Time domain — Select to show the time domain plot in the Window Viewer panel.
Frequency domain — Select to show the frequency domain plot in the Window Viewer panel.
Legend — Toggles the window name legend on and off. This option is also available with the Legend toolbar button.
Analysis Parameters — Controls the response plot parameters, including number of points, range, x- and y-axis units, sampling frequency, and normalized magnitude.
You can also access the Analysis Parameters by right-clicking the x-axis label of a plot in the Window Viewer panel. The x-axis units for the time domain plot depend on the selected
Sampling Frequencyunits.Frequency Domain
Time Domain
Hz
s
kHz
ms
MHz
µs
GHz
ns
Tools menu:
Zoom In — Zooms in along both x- and y-axes.
Zoom X — Zooms in along the x-axis only. Drag the mouse in the x direction to select the zoom area.
Zoom Y — Zooms in along the y-axis only. Drag the mouse in the y direction to select the zoom area.
Full View — Returns to full view.