Display
Display signal value during simulation
Libraries:
Simulink /
Dashboard
Description
The Display block connects to a signal in your model and displays its value during simulation. You can configure the appearance and format of the Display block to make intuitive sense for the value it displays. You can edit the parameters of the Display block during simulation. The Display block can display complex, vector, and 2-D matrix signals. Use the Display block with other dashboard blocks to build an interactive dashboard of controls and indicators for your model.
Connect Dashboard Blocks
Dashboard blocks do not use ports to connect to model elements. To connect a dashboard block,
use connect mode. To enter connect mode on an unconnected block, pause on the block you want
to connect and click the Connect button ![]() . To enter connect mode on a connected block, select the
block, pause on the ellipsis that appears (…), and in the action menu that expands, click
the Connect button.
. To enter connect mode on a connected block, select the
block, pause on the ellipsis that appears (…), and in the action menu that expands, click
the Connect button.
To connect a display block to a signal in your model or change the connection of a display
block, enter connect mode. Select the signal line to which you want to connect. From the
list that appears, select the signal to which you want to connect. Then, pause on the
dashboard block and click the Done Connecting button ![]() . To see the dashboard block display the value of the
connected block, run the simulation.
. To see the dashboard block display the value of the
connected block, run the simulation.
For more information about connecting dashboard blocks, see Connect Dashboard Blocks to Simulink Model.
You can also connect dashboard blocks to a Stateflow® chart. For more information, see Connect Dashboard Blocks to Stateflow (Stateflow).
This animation shows how to connect the Display block to your model.
Examples
You can use the Display block to show the value of a signal during simulation. For example, simulate the model displayRamp to see the value of the rampSig signal.
During simulation, the Display block displays the value output from the Ramp block, which starts at 0 and steadily increases to 10.

You can customize the format of the Display block to include text with the numerical output. For example, in the model CustomDisplayText, a Display block is connected to the Sine Wave signal. The Display block is configured to use a custom string format.
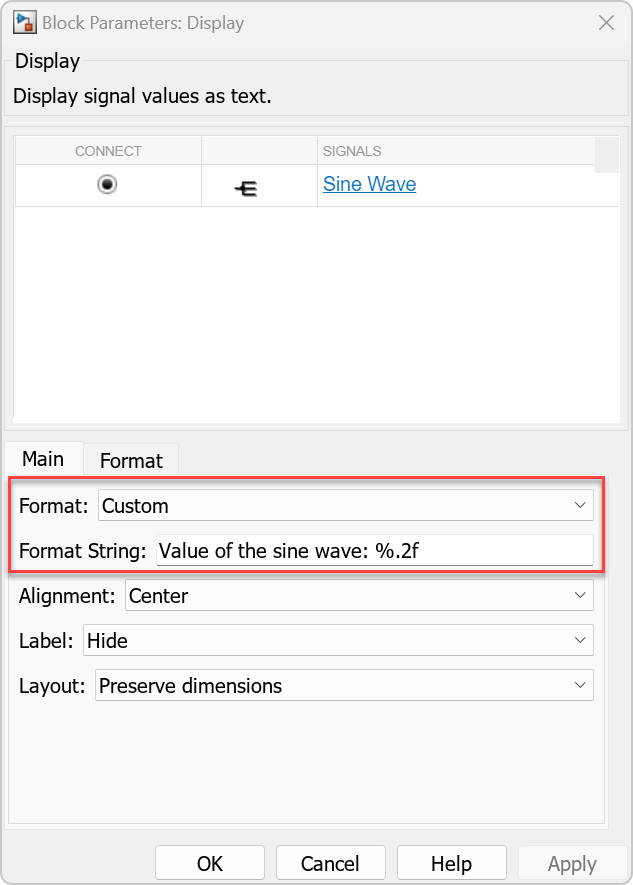
During simulation, the Display block displays text as well as the value of the Sine Wave signal.
Extended Examples
Interactively Simulate Vehicle Climate Control System
Use a dashboard of controls and indicators to interact with the simulation of an automobile climate control system.
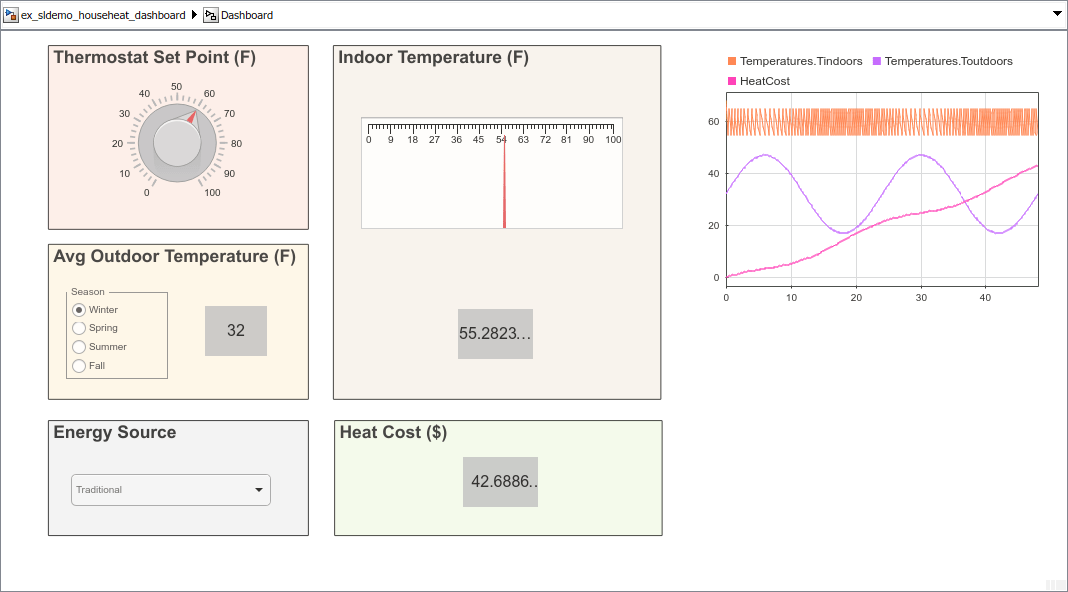
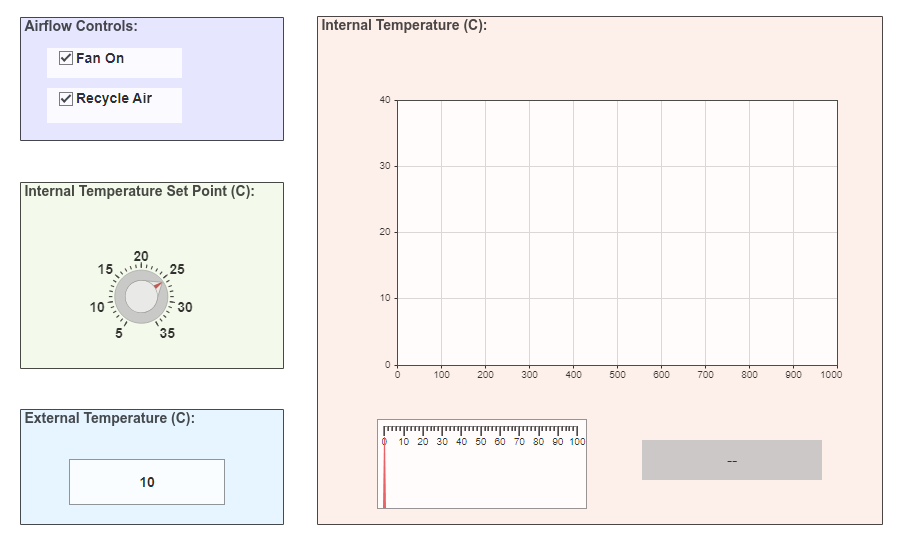
Interactively Simulate Thermal Model of House
Use Dashboard blocks to configure and then interactively simulate a thermal model of a house.
Limitations
You cannot use the Connection table to connect a dashboard block to a block that is commented out. When you connect a dashboard block to a commented block using connect mode, the dashboard block does not display the connected value until the you uncomment the block.
The toolstrip does not support dashboard blocks that are in a panel.
Dashboard blocks cannot connect to signals inside referenced models.
When you simulate a model hierarchy, dashboard blocks inside referenced models do not update.
Dashboard blocks do not support rapid accelerator simulation.
During simulation, you cannot connect a dashboard block to Stateflow chart data or state activity.
You cannot programmatically connect a dashboard block to Stateflow chart data or state activity.
Some signals do not have data available during simulation due to block reduction or optimization for accelerator mode simulations. To view such a signal using a dashboard block, mark the signal for logging.
Parameters
Connection
This block is a display block — a block that displays a signal value. Connect the block to the signal you want to display.
Dashboard blocks do not use ports to connect to model elements. To connect a dashboard block, use connect mode, the Simulink® Toolstrip, or the Connection table in the Block Parameters dialog box. For information, see Connect Dashboard Blocks to Simulink Model.
To connect to a signal using Connection table:
Select the block.
In the Property Inspector, on the Parameters tab, click Connect or Change.
Select the signal line to whose signal you want to connect.
In the table that appears, select the signal.
Click Apply.
You can also connect dashboard blocks to a Stateflow chart. For more information, see Connect Dashboard Blocks to Stateflow (Stateflow).
Programmatic Use
You can programmatically connect a display block to a signal. Define a Simulink.HMI.SignalSpecification
object that represents the signal. Then, set the value of the
Binding parameter to the object. To set the value of the
Binding parameter, use the set_param function.
For example, suppose the model named vdp contains a
Circular Gauge block named myGauge and a
signal named x1. To connect the block to the signal, use this
code.
blockPath = "vdp/myGauge";
signalPath = "vdp/x1";

myObj = Simulink.HMI.SignalSpecification;
myObj.BlockPath = Simulink.BlockPath(signalPath);

set_param(blockPath,Binding=myObj)
| Parameter: | Binding |
| Values: | Simulink.HMI.SignalSpecification object |
Example: set_param(gcb,Binding=myObj)
Main
Specify a format for displaying signal values.
| If You Select... | The Block Displays... |
|---|---|
short | Scaled fixed-decimal format with four digits after the decimal point. |
long | Scaled fixed-decimal format with fifteen digits
after the decimal point for
double values and seven digits
after the decimal point for
single values. |
shortE | Scientific notation format with four digits. |
longE | Scientific notation format with fifteen digits
after the decimal point for
double values and seven digits
after the decimal point for
single values. |
shortG | Data takes the more compact format between fixed-decimal or scientific notation, with a total of five digits. |
longG | Data takes the more compact format between
fixed-decimal or scientific notation, with a total
of fifteen digits for double
values and seven digits for
single values. |
shortEng | Engineering notation where the exponent is a multiple of three, with four digits after the decimal point. |
longEng | Engineering notation where the exponent is a multiple of three, with fifteen significant digits. |
+- | Positive/negative format. +,
-, and blank characters are
displayed for positive, negative, and zero values,
respectively. |
bank | Currency format with two digits after the decimal point. |
hex | Hexadecimal representation. |
rat | Ratio. |
Custom | Custom string format. Data is displayed in a custom string that you specify using the Format String parameter. |
Integer | Data rounded to the nearest whole number. |
When you connect the Display block to the
signal output by a String Constant block, the format for
displaying signal values is string, regardless of the
value of the Format parameter. Similarly, when you
connect the Display block to the signal output by an
Enumerated Constant block, the format for displaying
signal values is enum, regardless of the value of the
Format parameter.

Programmatic Use
To set the block parameter value programmatically, use
the set_param function.
| Parameter: | Format |
| Values: | 'short' (default) | "short" | "long" | "shortE" | "longE" | "shortG" | "longG" | "shortEng" | "longEng" | "bank" | "+" | "hex" | "rat" | "Custom" | "Integer" |
Example: set_param(gcb,Format="longG")
Custom string to format displayed signal data, specified as a string.
The format string consists of text and format operators, which start
with a % sign and end with a conversion character.
Use the format operators at the place in the string where you want the
signal data to display. For more information about supported formatting
operators, see the formatSpec input of the compose function.
Example: The value of pi is %.2f displays the value
of the connected signal within a sentence.
Example: $%.2f displays the value of the connected
signal with a dollar sign and two decimal places.
Dependencies
To enable this parameter, set the Format
parameter to Custom.
Programmatic Use
To set the block parameter value programmatically, use
the set_param function.
| Parameter: | FormatString |
| Values: | '%d' (default) | custom string or character array to format displayed
value |
Example: set_param(gcb,FormatString="The value of pi
is %.2f")
Text alignment in the Display block.
Programmatic Use
To set the block parameter value programmatically, use
the set_param function.
| Parameter: | Alignment |
| Values: | 'Center' (default) | "Left" | "Center" | "Right" |
Example: set_param(gcb,Alignment="Left")
Position of the block label. When the block is connected to an element in the model, the label is the name of the connected element.
Programmatic Use
To set the block parameter value programmatically, use
the set_param function.
| Parameter: | LabelPosition |
| Values: | 'Hide' (default) | "Hide" | "Bottom" | "Top" |
Example: set_param(gcb,LabelPosition="Top")
How to arrange elements of non-scalar data, specified as one of these options:
Preserve dimensions— Display elements arranged to match signal dimensions.Fill available space— Display as many elements as possible within available space.
Programmatic Use
To set the block parameter value programmatically, use
the set_param function.
| Parameter: | Layout |
| Values: | 'Preserve
dimensions' (default) | "Preserve dimensions" | "Fill available space" |
Example: set_param(gcb,Layout="Fill available
space")
Format
Whether to show a grid on the block when the block displays non-scalar data. Specify the color of the grid using the Grid Color parameter.
Programmatic Use
To set the block parameter value programmatically, use
the set_param function.
| Parameter: | ShowGrid |
| Values: | 'on' (default) | "on" | "off" |
Example: set_param(gcb,ShowGrid="off")
Block background opacity, specified as a scalar value between 0
and 1. When the specified value is 1, the
background is fully opaque.
Programmatic Use
To set the block parameter value programmatically, use
the set_param function.
| Parameter: | Opacity |
| Values: | '1' (default) | scalar with values between 0 and
1 formatted as string or character vector |
Example: set_param(gcb,Opacity="0.5")
Block foreground color, including the text. You can select a color from a palette of standard colors or specify a custom color.
Programmatic Use
To set the block parameter value programmatically, use
the set_param function.
| Parameter: | ForegroundColor |
| Values: | [r g b] vector with values between
0 and 1 formatted as a string
or character vector |
Example: set_param(gcb,ForegroundColor="[1 0
1]")
Block background color. You can select a color from a palette of standard colors or specify a custom color.
Programmatic Use
To set the block parameter value programmatically, use
the set_param function.
| Parameter: | BackgroundColor |
| Values: | [r g b] vector with values between
0 and 1 formatted as a string
or character vector |
Example: set_param(gcb,BackgroundColor="[1 0
1]")
Block grid color. The grid shows when the block displays non-scalar data. You can select a color from a palette of standard colors or specify a custom color.
Programmatic Use
To set the block parameter value programmatically, use
the set_param function.
| Parameter: | GridColor |
| Values: | [r g b] vector with values between
0 and 1 |
Example: set_param(gcb,GridColor=[1 0
0])
Block Characteristics
Data Types |
|
Direct Feedthrough |
|
Multidimensional Signals |
|
Variable-Size Signals |
|
Zero-Crossing Detection |
|