Debug Custom C/C++ Code
When you integrate custom C/C++ code into your model, you can debug your code from within Simulink® by launching an external debugger and setting breakpoints in your custom code. This option applies to custom code specified in the Simulation Target pane of the Model Configuration Parameters dialog box. You can integrate this custom code into your model using any of these blocks:
C Caller
C Function
MATLAB Function
MATLAB System
Stateflow® chart
Note
To debug custom code, the Import custom code check box in the Simulation Target pane of the Model Configuration Parameters dialog must be selected. This parameter is selected by default.
Note
Starting in R2024a, these debugging steps are applicable for custom C/C++ code locally
specified in a C Function block. To specify custom code locally in a C
Function, set the Configure custom code
settings parameter to Use Block Custom Code.
This table gives information about debugger support.
| Operating System | Supported Debuggers |
|---|---|
Windows® | Microsoft® Visual Studio® IDE. |
Visual Studio Code with MinGW® GDB. Requires installation of MATLAB® Coder™ Interface for Visual Studio Code Debugging support package. See https://www.mathworks.com/matlabcentral/fileexchange/103555-matlab-coder-interface-for-visual-studio-code-debugging. | |
Linux® | GNU® Data Display Debugger (DDD). |
Visual Studio Code with GDB. Requires installation of MATLAB Coder Interface for Visual Studio Code Debugging support package. See https://www.mathworks.com/matlabcentral/fileexchange/103555-matlab-coder-interface-for-visual-studio-code-debugging. |
Note
Debugging custom C/C++ code is not supported in macOS.
To select a compiler to use with C or C++ code, execute the command mex -setup
C or mex -setup C++.
To launch the external debugger, on the Debug tab of the Simulink toolstrip, in the Breakpoints section, click the arrow to
the right of the Add Breakpoint button. From the menu, select
Set Breakpoints in Custom Code.

Debugging is supported only when simulating in normal or accelerated mode and only in normal mode for referenced models. If debugging is not supported, the button to launch the debugger is disabled.
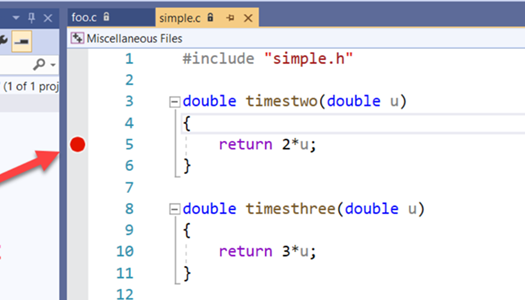
Once the debugger is launched, you can set breakpoints in your custom code.
Note
The Select Entities to Debug dialog box that lists all the entities that can be debugged in the model opens if your model contains an S-function or S-function Builder block. Select the model name under Model Custom Code in the dialog box to debug the custom C/C++ code specified in the Simulation Target pane of the Model Configuration Parameters dialog box.

When you simulate your model, the simulation pauses when it reaches a breakpoint in the custom code. Note that when the simulation is paused during debugging, the simulation time step display at the bottom of the Simulink window may not be up-to-date.

To end a debugging session, first detach the active process from the debugger, then close the debugger window.
Caution
Do not kill the process attached to the debugger. Issuing a
kill command from the process in which the debugger is running
can cause MATLAB to stop running, and you can lose work.
Note
On Linux platform, do not close the debugger before issuing a
detach command from the process in which the debugger is
running.
Note
To use the Microsoft
Visual Studio debugger in in-process mode, you must set the value of the Windows registry key
HKEY_LOCAL_MACHINE\SYSTEM\CurrentControlSet\Control\Session
          Manager\DebuggerMaxModuleMsgs
to 4096 or greater.
To obtain the current value of DebuggerMaxModuleMsgs, execute this
command in MATLAB.
winqueryreg('HKEY_LOCAL_MACHINE','SYSTEM\CurrentControlSet\Control\Session Manager','DebuggerMaxModuleMsgs')
If this key does not exist or is set to a lower number than 4096, use this procedure to set it:
Start the Registry Editor.
Locate this subkey in the registry, and click Session Manager:
HKEY_LOCAL_MACHINE\SYSTEM\CurrentControlSet\Control\Session Manager
In the list of entries on the right, if
DebuggerMaxModuleMsgsexists, go to step 6. Otherwise, continue to step 4.On the Registry Editor window, select Edit > New > DWORD Value.
In the list of entries on the right, change the new value name to
DebuggerMaxModuleMsgsand press Enter.Right-click the
DebuggerMaxModuleMsgsentry name and select Modify.In the Edit DWORD Value dialog box, in the Value data field, enter
4096. For the Base value, selectDecimal. Click OK.Close the Registry Editor.
Reboot your machine.
In-Process and Out-of-Process Simulation
When simulating a model containing custom C or C++ code, you have the option to run the custom code in a separate process outside of MATLAB. This process is called out-of-process simulation. This option may be useful when debugging your custom code. By running in a separate process, problems with the custom code do not cause MATLAB to crash, and you can more easily debug and resolve such problems. Problems can arise due to unexpected exceptions in the custom code or errors in the interface between Simulink and the custom code.
To enable out-of-process simulation, in the Model Configuration Parameters dialog box, in the Simulation Target pane, on the Import settings tab, select Simulate custom code in a separate process.

If Simulate custom code in a separate process is not selected, that is, if you are using in-process simulation, then when you launch an external debugger, the entire MATLAB process attaches to the debugger. This action could cause the debugger to take more time to launch. Debugging is generally faster with out-of-process simulation. However, not all custom code functions are supported in out-of-process simulation.
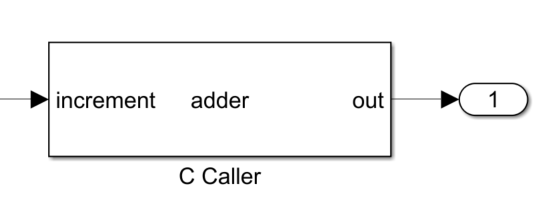
When you simulate a model out-of-process, if you encounter a run-time exception, Simulink gives you the option to launch the external debugger. For example, this model contains a C Caller block that calls the function adder(), which accesses an object called adderObj. Before calling the function, the object must be created, which you can do by calling initAdder() from the Initialize code specified on the Additional source code tab of the Simulation Target pane of the Model Configuration Parameters dialog box.


If initAdder() is not called before adder(), then adder() attempts to access an uninitialized pointer, which causes a run-time exception. During in-process simulation, this exception can cause MATLAB to crash when you simulate the model. However, with out-of-process simulation, simulating the model produces an error message within Simulink.

You can then click Open to launch your external debugger and resolve the issue that caused the error.

After the debugger launches, it restarts the simulation and stops at the breakpoints of custom function entries automatically.