Rearrange and Remove Widgets in Metrics Dashboard
This example shows how to use the metric APIs to rearrange existing widgets in the default layout of the Metrics Dashboard and remove widgets from the Metrics Dashboard.
Rearrange Widgets in Layout
Suppose you want to take the default layout of the Metrics Dashboard and modify the layout to move the bar charts for Actual Reuse and Potential Reuse to the bottom of the Architecture section.
1. Open the default configuration for the Metrics Dashboard.
dashboardconfig = slmetric.dashboard.Configuration.openDefaultConfiguration();
2. Get the dashboard layout from the configuration.
layout = getDashboardLayout(dashboardconfig);
Dashboard layouts contain nested layers of objects. You can use the getWidgets function to get the objects in the next layer of the layout. For more information, see getWidgets.
3. To return the sections in the dashboard layout, use the getWidgets function.
sections = getWidgets(layout)
sections=1×4 object
    1×1 Container    1×1 Group    1×1 Group    1×1 Group
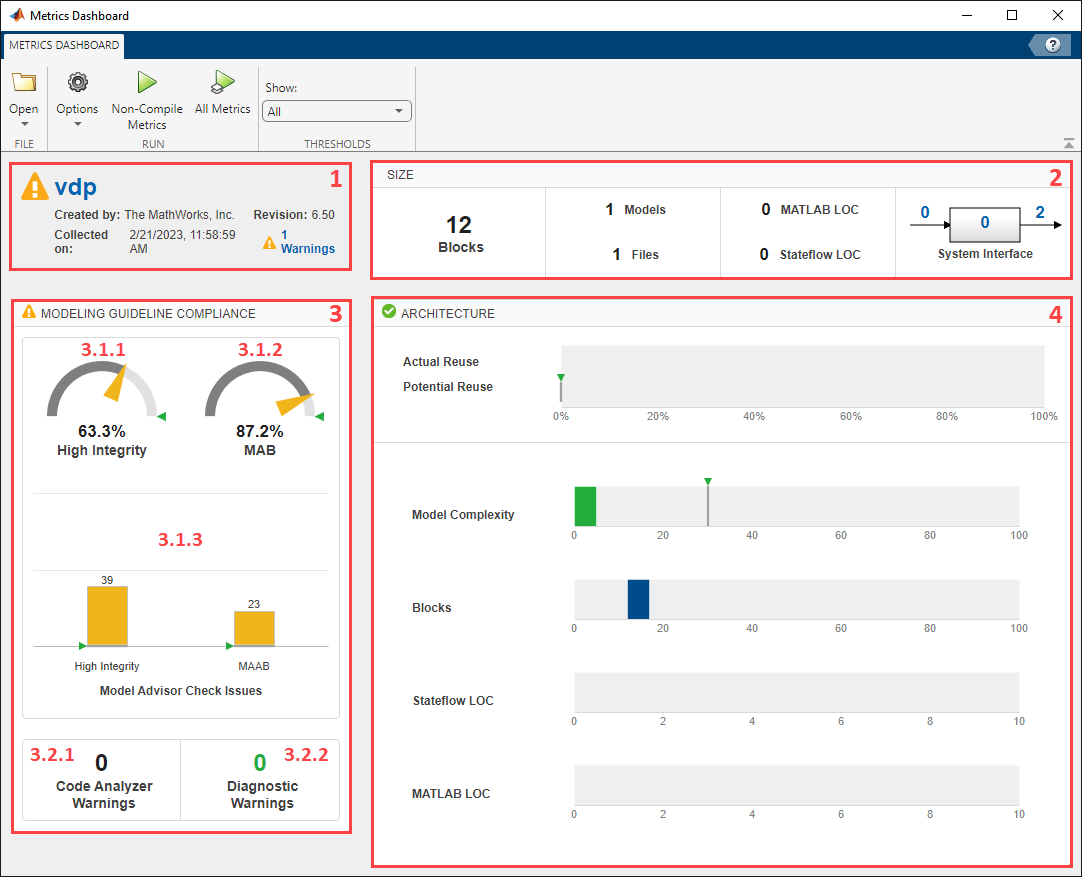
sections is a 1x4 Container because the default layout for the Metrics Dashboard has four main sections:
sections(1)contains the system information for the current model.sections(2)contains the widgets shown in the Size section. The widgets use the Size Metrics from the Model Metrics.sections(3)contains the widgets shown in the Modeling Guideline Compliance section. The widgets use the Compliance Metrics from the Model Metrics.sections(4)contains the widgets shown in the Architecture section. The widgets use the Architecture Metrics from the Model Metrics.
In the diagram, the red numbers 1, 2, 3, and 4 indicate the locations of the 4 main sections in the Metrics Dashboard.
4. Save the Architecture section to the variable archSection. You can access the Architecture section by using sections(4).
archSection = sections(4);
5. To see what the Architecture section contains, use the getWidgets function.
archSectionContents = getWidgets(archSection)
archSectionContents=1×2 object
    1×1 Widget    1×1 Container
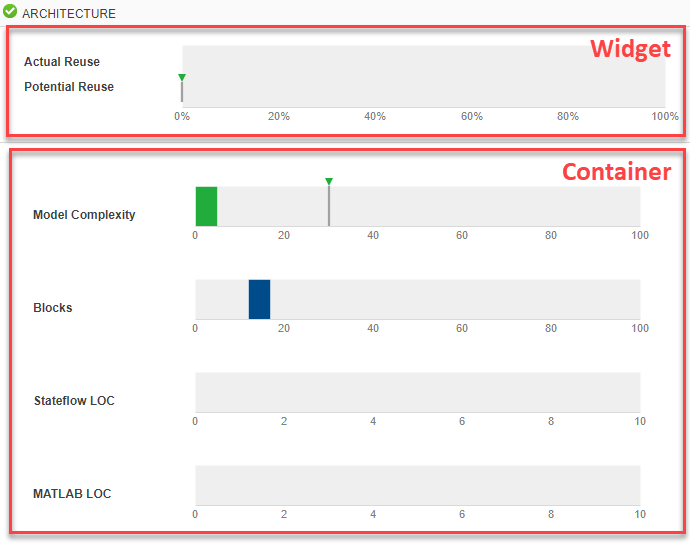
The Architecture section contains a Widget object and a Container object inside an array. The Widget is the first element of the array. The Container is the second element of the array.
The order of the objects in the array corresponds to the order the objects appear in the dashboard. In the Architecture section, the first element appears at the top of the section. The second element appears at the bottom of the section.
In the default configuration:
The first element of the array corresponds to the
Widgetthat creates the bar charts for Actual Reuse and Potential Reuse.The second element of the array corresponds to the
Containerfor the Model Complexity, Blocks, Stateflow LOC, and MATLAB LOC widgets. Note that LOC refers to lines of code. For more information, see Model Metrics.
6. Save the first element of the array to the variable reuseWidget.
reuseWidget = archSectionContents(1) % widgetreuseWidget =
Widget with properties:
Title: 'Library Reuse'
Type: 'LibraryReuse'
ID: '006e5f20-5400-4fbf-add9-80ed1be98d2f'
The Type of reuseWidget is 'LibraryReuse'. The 'LibraryReuse' type of widget creates the Actual Reuse and Potential Reuse bar charts.
7. Use the getPosition function to confirm that the reuseWidget widget is currently in the first position inside the Architecture section.
getPosition(reuseWidget)
ans =
1
8. Move the reuseWidget widget to the bottom of the Architecture section by setting the position of the reuseWidget object to be the second element in the array of objects in the section.
setPosition(reuseWidget,2);
9. Save the updated configuration, dashboardconfig, as an XML file. The XML file contains the new, rearranged layout for the Architecture section.
save(dashboardconfig,'Filename','DashboardConfig.xml');
10. Set the XML file as the active configuration for the Metrics Dashboard.
slmetric.dashboard.setActiveConfiguration(fullfile(pwd,'DashboardConfig.xml'));11. The Metrics Dashboard uses the active configuration the next time you open the dashboard on a model.
metricsdashboard vdpWarning: The Metrics Dashboard and slmetric.Engine API will be removed in a future release. For size, architecture, and complexity metrics, use the Model Maintainability Dashboard and metric.Engine API instead. The Model Maintainability Dashboard and metric.Engine API can identify outdated metric results, analyze dependencies between files, and aggregate metrics across software units and components. For more information, see <a href="matlab:helpview([docroot '/slcheck/collect-model-metric-data-1.html'])">Collect Model and Testing Metrics</a>
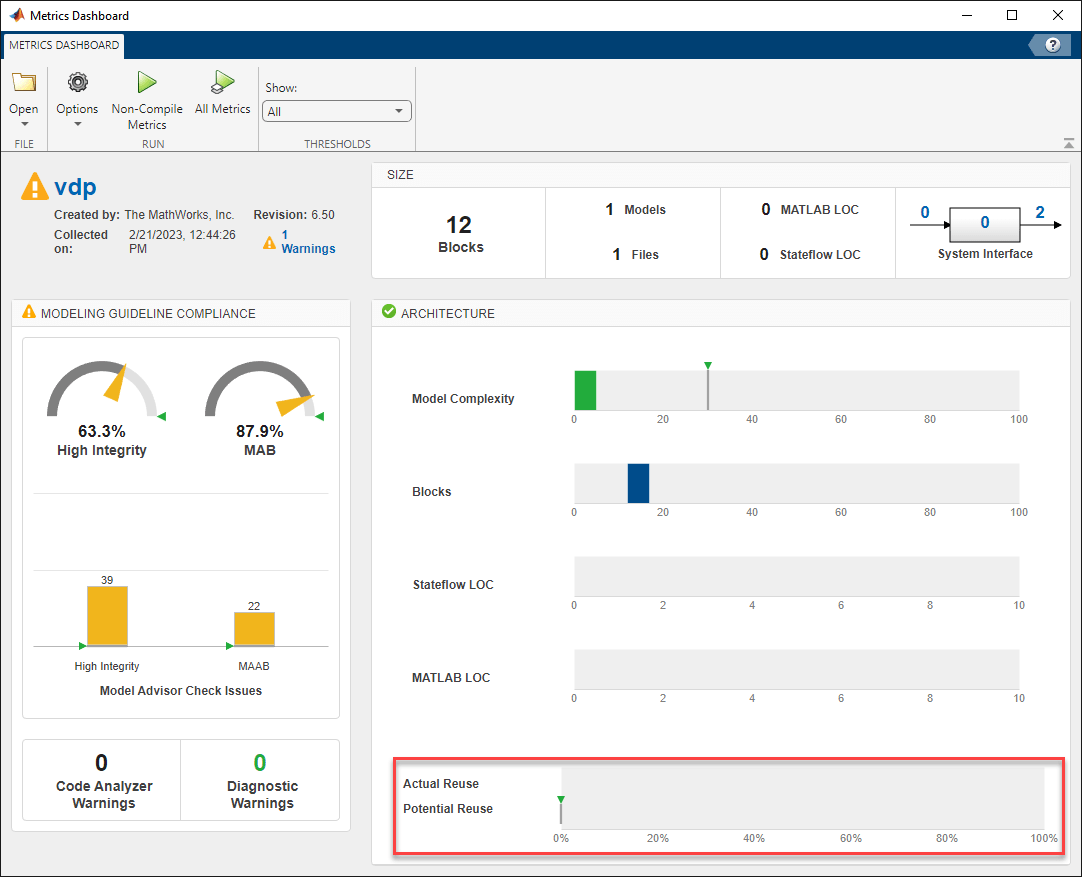
12. Click All Metrics to collect each of the metrics in the dashboard.
Since the reuseWidget widget is set to the second position, the bar charts for Actual Reuse and Potential Reuse now appear at the bottom of the Architecture section.
12. Close the Metrics Dashboard.
Remove Widgets from Layout
Suppose you want to remove the Stateflow LOC and MATLAB LOC widgets from the Architecture section of the Metrics Dashboard.
1. Get the new dashboard layout for the configuration that you updated in the previous section.
layout = getDashboardLayout(dashboardconfig);
2. Use the getWidgets function to return the sections in the dashboard layout.
sections = getWidgets(layout);
3. Save the Architecture section to the variable archSection.
archSection = sections(4);
4. Use the getWidgets function to see what the Architecture section contains.
archSectionContents = getWidgets(archSection)
archSectionContents=1×2 object
    1×1 Container    1×1 Widget
Since you rearranged the widgets in the previous section, the Container is now the first element in the array. The Container contains the Model Complexity, Blocks, Stateflow LOC, and MATLAB LOC widgets.
5. Save the Container to the variable archContainer.
archContainer = archSectionContents(1);
6. Use the getWidgets function to get the widgets inside the Container.
archContainerWidgets = getWidgets(archContainer);
archContainerWidgets is a 1x4 CustomWidget array where:
archContainerWidgets(1)contains the widget for Model ComplexityarchContainerWidgets(2)contains the widget for BlocksarchContainerWidgets(3)contains the widget for Stateflow LOCarchContainerWidgets(4)contains the widget for MATLAB LOC
7. Remove the Stateflow LOC widget from the Container.
removeWidget(archContainer,archContainerWidgets(3));
8. Remove the MATLAB LOC widget from the Container.
removeWidget(archContainer,archContainerWidgets(4));
9. Save the updated configuration, dashboardconfig, as an XML file. The XML file contains the new, rearranged layout for the Architecture section.
save(dashboardconfig,'Filename','DashboardConfig.xml');
10. Set the XML file as the active configuration for the Metrics Dashboard.
slmetric.dashboard.setActiveConfiguration(fullfile(pwd,'DashboardConfig.xml'));11. The Metrics Dashboard uses the active configuration the next time you open the dashboard on a model.
metricsdashboard vdpWarning: The Metrics Dashboard and slmetric.Engine API will be removed in a future release. For size, architecture, and complexity metrics, use the Model Maintainability Dashboard and metric.Engine API instead. The Model Maintainability Dashboard and metric.Engine API can identify outdated metric results, analyze dependencies between files, and aggregate metrics across software units and components. For more information, see <a href="matlab:helpview([docroot '/slcheck/collect-model-metric-data-1.html'])">Collect Model and Testing Metrics</a>
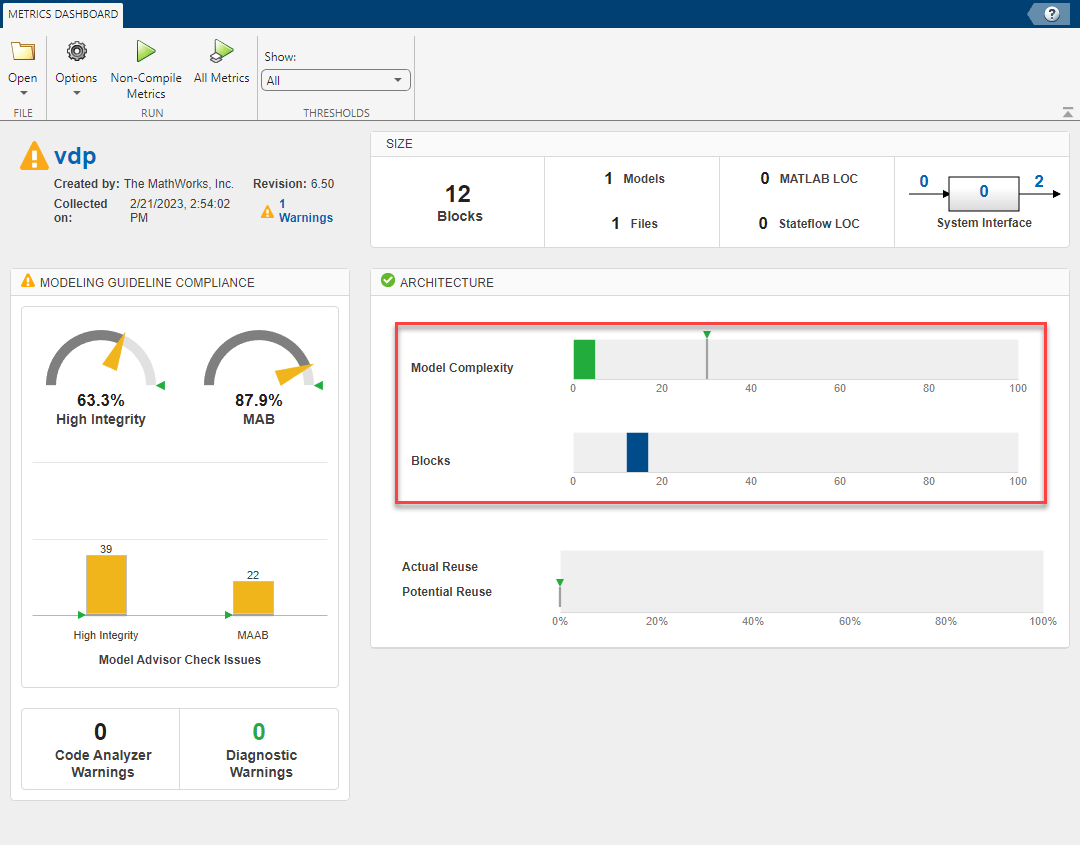
The Architecture section no longer shows the Stateflow LOC and MATLAB LOC widgets.
See Also
getWidgets | removeWidget | slmetric.dashboard.Configuration