Interpret Numeric Tuning Results
When you tune a control system with systune or Control System
Tuner, the software provides reports that give you an overview of how well the tuned
control system meets your design requirements. Interpreting these reports requires
understanding how the tuning algorithm optimizes the system to satisfy your tuning goals. (The
software also provides visualizations of the tuning goals and system responses to help you see
where and by how much your requirements are not satisfied. For information about using these
plots, see Visualize Tuning Goals.)
Tuning-Goal Scalar Values
The tuning software converts each tuning goal into a normalized scalar value which it then constrains (hard goals) or minimizes (soft goals). Let fi(x) and gj(x) denote the scalar values of the soft and hard goals, respectively. Here, x is the vector of tunable parameters in the control system to tune. The tuning algorithm solves the minimization problem:
Minimize subject to , for .
xmin and xmax are the minimum and maximum values of the free parameters of the control system. (For information about the specific functions used to evaluate each type of requirement, see the reference pages for each tuning goal.)
When you use both soft and hard tuning goals, the software solves the optimization as a sequence of subproblems of the form:
The software adjusts the multiplier α so that the solution of the subproblems converges to the solution of the original constrained optimization problem.
The tuning software reports the final scalar values for each tuning goal. When the final value of fi(x) or gj(x) is less than 1, the corresponding tuning goal is satisfied. Values greater than 1 indicate that the tuning goal is not satisfied for at least some conditions. For instance, a tuning goal that describes a frequency-domain constraint might be satisfied at some frequencies and not at others. The closer the value is to 1, the closer the tuning goal is to being satisfied. Thus these values give you an overview of how successfully the tuned system meets your requirements.
The form in which the software presents the optimized tuning-goal values depends on whether you are tuning with Control System Tuner or at the command line.
Tuning Results at the Command Line
The systune command returns the control system model or
slTuner interface with the tuned parameter values.
systune also returns the best achieved values of each
fi(x) and
gj(x) as the vector-valued
output arguments fSoft and gHard, respectively. See
the systune reference page for more information. (To obtain the final tuning goal
values on their own, use evalGoal.)
By default, systune displays the best achieved final values of the
tuning goals in the command window. For instance, in the example PID Tuning for Setpoint Tracking vs. Disturbance Rejection,
systune is called with one soft requirement, R1,
and two hard requirements R2 and R3.
T1 = systune(T0,R1,[R2 R3]);
Final: Soft = 1.12, Hard = 0.99988, Iterations = 143
This display indicates that the largest optimized value of the hard tuning goals is less than 1, so both hard goals are satisfied. The soft goal value is slightly greater than one, indicating that the soft goal is nearly satisfied. You can use tuning-goal plots to see in what regimes and by how much the tuning goals are violated. (See Visualize Tuning Goals.)
You can obtain additional information about the optimization progress and values using
the info output of systune. To make
systune display additional information during tuning, use systuneOptions.
Tuning Results in Control System Tuner
In Control System Tuner, when you click ![]() , the app compiles a Tuning Report summarizing the best
achieved values of fi(x) and
gj(x). To view the tuning
report immediately after tuning a control system, click Tuning Report
at the bottom-right corner of Control System Tuner.
, the app compiles a Tuning Report summarizing the best
achieved values of fi(x) and
gj(x). To view the tuning
report immediately after tuning a control system, click Tuning Report
at the bottom-right corner of Control System Tuner.

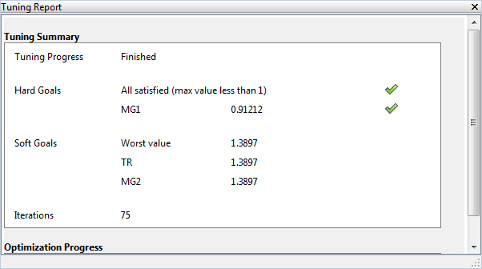
The tuning report displays the final fi(x) and gj(x) values obtained by the algorithm.

The Hard Goals area shows the minimized gi(x) values and indicates which are satisfied. The Soft Goals area highlights the largest of the minimized fi(x) values as Worst Value, and lists the values for all the requirements. In this example, the hard goal is satisfied, while the soft goals are nearly satisfied. As in the command-line case, you can use tuning-goal plots to see where and by how much tuning goals are violated. (See Visualize Tuning Goals.)
Tip
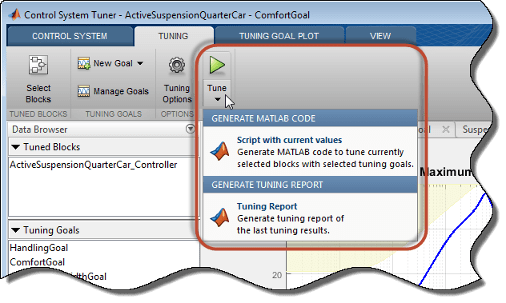
You can view a report from the most recent tuning run at any time. In the
Tuning tab, click
Tune![]() , and select
, and select Tuning Report.

Improve Tuning Results
If the tuning results do not adequately meet your design requirements, adjust your set of tuning goals to improve the results. For example:
Designate tuning goals that are must-have requirements as hard goals. Or, relax tuning goals that are not absolute requirements by designating them as soft goals.
Limit the frequency range in which frequency-domain goals are enforced.
In Control System Tuner, use the Enforce goal in frequency range field of the tuning goal dialog box.
At the command line, use the
Focusproperty of theTuningGoalobject.
If the tuning results do satisfy your design requirements, you can validate the tuned control system as described in Validate Tuned Control System.
See Also
systune | systune (for slTuner) | viewGoal | evalGoal