Receive Tone Signal Using Analog Devices AD9361/AD9364
This example shows how to use the SoC Blockset™ Support Package for AMD® FPGA and SoC Devices software to perform a simple loopback of a complex sinusoid signal at RF Using Analog Devices™ AD9361/AD9364. A direct digital synthesizer (DDS) in the FPGA generates a complex sinusoid and transmits it using the RF card. The transmitted signal is then received by the RF card and the downsampled baseband signal is visualized in MATLAB®. This example confirms that the SDR hardware is setup correctly and shows how to capture RF data from SDR hardware using MATLAB.
Configure SDR Hardware
If you are running this example after performing the setup of hardware using Support Package Installer then you can skip this section. Otherwise, follow Set Up AMD FPGA and SoC Devices to configure your host computer to work with the SDR hardware. Connect an SMA loopback cable with attenuation between TX1A and RX1A (for FMCOMMS2 or FMCOMMS3), between TXA and RXA (for FMCOMMS4), between TX1A_A and RX1A_A (for FMCOMMS5), or attach appropriate antenna suitable for 2.4 GHz band.
if ~exist('prmToneRx','var')
    prmToneRx.SDRDeviceName = 'AD936x';
    prmToneRx.IPAddress = '192.168.3.2';
end
% To update the example for FMCOMMS5, set |prmToneRx.SDRDeviceName| to
% |'FMCOMMS5'|.
Transmit a Tone Signal from the FPGA
Set the DDS in the FPGA fabric to transmit a complex sinusoid to the RF card. This is provided in the FPGA for testing and debugging purposes.
Create a transmitter System object™ to configure the RF card settings. Set the RF card to transmit data at a center frequency of 2.4 GHz.
RadioBasebandRate = 1e6;
CenterFrequency = 2.4e9;
ToneFrequency = 25e3;

sdrTransmitter = sdrtx(prmToneRx.SDRDeviceName, ...
    'IPAddress',       prmToneRx.IPAddress, ...
    'CenterFrequency', CenterFrequency);
Turn on the properties related to DDS by setting ShowAdvancedProperties to true. Set the DataSourceSelect property of sdrTransmitter System object to 'DDS'. Set the tone frequency and scale for DDS.
sdrTransmitter.ShowAdvancedProperties = true;
sdrTransmitter.BasebandSampleRate = RadioBasebandRate;
sdrTransmitter.DataSourceSelect = 'DDS';
sdrTransmitter.DDSTone1Scale = 0.1;
sdrTransmitter.DDSTone2Scale = 0.1;
sdrTransmitter.DDSTone1Freq = ToneFrequency;
sdrTransmitter.DDSTone2Freq = ToneFrequency;
sdrTransmitter.Gain = 0;
sdrTransmitter.BypassUserLogic = true;
Next, initiate the transmission of data from DDS to RF card.
sdrTransmitter();
## Establishing connection to hardware. This process can take several seconds.
Note that the simultaneous transmission and reception of data from MATLAB to RF card (duplex) is currently not supported. Therefore, for this example the data is generated in FPGA using DDS and transmitted directly to the RF card. MATLAB is only used for signal reception
Capture RF Signal
To capture the RF tone signal into MATLAB create an SDR receiver System object and configure it to receive the samples at the baseband rate.
% Radio parameters
RadioFrameLength = 4000;

% Create a receiver System object with desired radio parameters
sdrReceiver = sdrrx(prmToneRx.SDRDeviceName, ...
    'IPAddress',              prmToneRx.IPAddress, ...
    'CenterFrequency',        CenterFrequency, ...
    'BasebandSampleRate',     RadioBasebandRate,...
    'GainSource',             'AGC Fast Attack', ...
    'SamplesPerFrame',        RadioFrameLength, ...
    'ChannelMapping',         1, ...
    'OutputDataType',         'double', ...
    'ShowAdvancedProperties', true, ...
    'BypassUserLogic',        true);
To visualize the received signal in frequency and time domain use spectrum analyzer and time scope System objects. In addition, set up a constellation diagram System object for plotting signal as two dimensional scatter diagram in the complex plane.
spectrumScope = spectrumAnalyzer('SampleRate', RadioBasebandRate);
timeScope = timescope('TimeSpanSource','property','TimeSpan',5/ToneFrequency,'SampleRate',RadioBasebandRate);
constellation = comm.ConstellationDiagram('ShowReferenceConstellation', false);
Set the simulation to capture 100 milliseconds of data.
StopTime        = 100e-3;                                 % seconds
RadioFrameTime  = (RadioFrameLength / RadioBasebandRate); % seconds
If the processing of received data in MATLAB is slower than the speed at which the data is captured, you will encounter loss of samples. This will be reflected by non-zero value of overflow variable. To ensure reception of contiguous data in MATLAB you can capture signals by enabling Burst Mode and by specifying the number of frames as the size of burst. In this mode, the specified amount of data is captured in a buffer first and later it is available for processing in MATLAB. Due to a limitation in the burst mode, overflows in the first step when using burst mode are ignored.
numFramesinBurst = ceil(RadioBasebandRate*StopTime/RadioFrameLength);
sdrReceiver.EnableBurstMode = true;
sdrReceiver.NumFramesInBurst = numFramesinBurst;
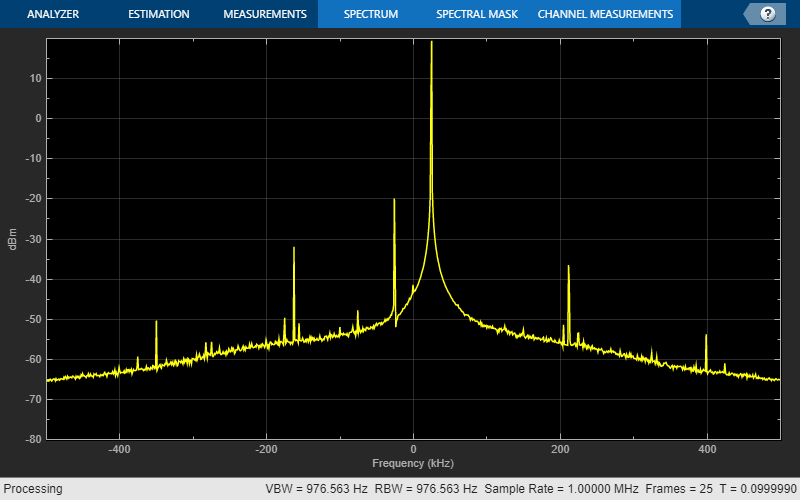
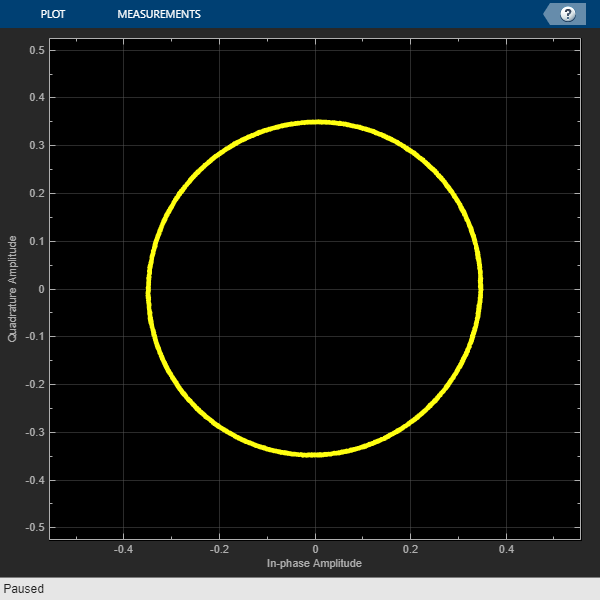
Capture and visualize data by calling the corresponding System objects in a loop. You will notice a peak at 25 kHz corresponding to the received tone signal in frequency spectrum in Signal Analyzer. Depending on the quality of signal received, you may see a peak around DC and negative 25 kHz in frequency spectrum indicating existence of a DC offset and IQ imbalance respectively. You should see sinusoidal signals (real and imaginary) in the time domain, shown in the Time Scope display. In Constellation Diagram display, you should see a ring like plot visualizing the complex sinusoidal vector signal in the complex plane. The ring should be a perfect circle. Any warping of the circle is an indication of IQ imbalance.
try
    % Loop until the example reaches the target stop time.
    timeCounter = 0;

    while timeCounter < StopTime

        [data, valid, overflow] = sdrReceiver();
        if (overflow > 0) && (timeCounter > 0)
            disp("Dropped samples");
        end

        if valid
            % Visualize frequency spectrum
            spectrumScope(data);
            % Visualize in time domain
            timeScope([real(data), imag(data)]);
            % Visualize the scatter plot
            constellation(data);

            % Set the limits in scopes
            dataMaxLimit = max(abs([real(data); imag(data)]));
            constellation.XLimits = [-dataMaxLimit*1.5, dataMaxLimit*1.5];
            constellation.YLimits = [-dataMaxLimit*1.5, dataMaxLimit*1.5];
            timeScope.YLimits = [-dataMaxLimit*2, dataMaxLimit*2];
            timeCounter = timeCounter + RadioFrameTime;
        end
    end
catch ME
    rethrow(ME);
end
## Establishing connection to hardware. This process can take several seconds.


Release the SDR transmitter/receiver and visualization scopes.
release(sdrReceiver);
release(sdrTransmitter);
Conclusion
In this example, you used SDR Transmitter and Receiver System objects to transmit a complex sinusoidal signal from the FPGA and receive it in MATLAB. You visualized the received signal in time, frequency and on the complex plane. By performing this loopback test, you can confirm that the SDR system is setup correctly. You can now proceed to use it in conjunction with Communications Toolbox to develop your baseband algorithms and verify using real world RF data.