grpstats
Summary statistics organized by group
Syntax
Description
tblstats = grpstats(tbl,groupvars)tbl, where the function determines the groups according
to the grouping variables in tbl specified by
groupvars.
If all variables in tbl (other than the grouping
variables) are numeric or logical, then the summary statistic is the mean of
each group for each variable in tbl. Otherwise, the summary
statistic is the number of elements in each group. tblstats
contains a row for each observed unique value or combination of values in the
grouping variables.
tblstats = grpstats(tbl,groupvars,whichstats)whichstats.
tblstats = grpstats(tbl,groupvars,whichstats,Name,Value)"DataVars",[2,4] instructs the function to compute
summary statistics for the second and fourth variables in
tbl.
stats = grpstats(X,group)X, where the function determines the groups by the
grouping variables in group.
If X is a numeric or logical matrix, then the summary
statistic is the mean of each group for each column of X.
Otherwise, the summary statistic is the number of elements in each group.
stats contains a row for each observed unique
combination of the grouping variables.
[
specifies the summary statistic types stats1,...,statsN] = grpstats(X,group,whichstats)whichstats and
returns an array for each summary statistic.
[
also specifies the significance level stats1,...,statsN] = grpstats(X,group,whichstats,"Alpha",a)a for confidence and
prediction intervals.
grpstats(
plots the group means of data in the numeric or logical matrix
X,group,alpha)X, grouped by the variables in
group. The function also plots the 100×(1 –
alpha)% confidence interval for each group mean. The
grouping variable values are on the horizontal plot axis.
If
Xis a matrix, thengrpstatsplots the means and confidence intervals for each column ofX.If
groupis a cell array of grouping variables, thengrpstatsplots the means and confidence intervals for the groups determined by the observed unique combinations of the grouping variables.
Examples
Compute summary statistics for input data in a table. Group the input data using one or two grouping variables, and specify one or two types of summary statistics to compute.
Load the patients data set.
load patientsCreate a table that contains the variables Gender, Age, Weight, and Smoker.
tbl = table(Gender,Age,Weight,Smoker);
Gender is a cell array with the two unique values Male and Female. The variables Age and Weight have numeric values, and Smoker has logical values.
Compute the mean for the numeric and logical arrays in tbl grouped by Gender.
tblstats1 = grpstats(tbl,"Gender")tblstats1=2×5 table
Gender GroupCount mean_Age mean_Weight mean_Smoker
__________ __________ ________ ___________ ___________
Male {'Male' } 47 38.915 180.53 0.44681
Female {'Female'} 53 37.717 130.47 0.24528
tblstats1 is a table with two rows corresponding to the unique values in Gender. The GroupCount column shows the number of observations in each group. The columns mean_Age, mean_Weight, and mean_Smoker show the means of Age, Weight, and Smoker grouped by Gender.
Compute the mean for Age and Weight grouped by the values in Smoker. Specify Age and Weight as the variables for which you want to compute summary statistics by using the DataVars name-value argument. You must use DataVars because the input tbl includes the Gender variable, which is a cell array, and the built-in summary statistic mean is valid only for numeric and logical arrays.
tblstats2 = grpstats(tbl,"Smoker","mean","DataVars",["Age","Weight"])
tblstats2=2×4 table
         Smoker    GroupCount    mean_Age    mean_Weight
         ______    __________    ________    ___________

    0    false         66          37.97       149.91
    1    true          34         38.882       161.94
Compute the minimum and maximum weight grouped by the combinations of values for Gender and Smoker.
tblstats3 = grpstats(tbl,["Gender","Smoker"],["min","max"], ...
    "DataVars","Weight")
tblstats3=4×5 table
                  Gender      Smoker    GroupCount    min_Weight    max_Weight
                __________    ______    __________    __________    __________

    Male_0      {'Male'  }    false         26           158           194
    Male_1      {'Male'  }    true          21           164           202
    Female_0    {'Female'}    false         40           111           147
    Female_1    {'Female'}    true          13           115           146
Smoker and Gender each have two unique values, so the output table includes four rows for the possible combinations: Male Nonsmoker (Male_0), Male Smoker (Male_1), Female Nonsmoker (Female_0), and Female Smoker (Female_1).
Specify the names for the columns in the output by using the VarNames name-value argument.
tblstats4 = grpstats(tbl,["Gender","Smoker"],["min","max"], ...
    "DataVars","Weight", ...
    "VarNames",["Gender","Smoker","Group Count", ...
    "Lowest Weight","Highest Weight"])
tblstats4=4×5 table
                  Gender      Smoker    Group Count    Lowest Weight    Highest Weight
                __________    ______    ___________    _____________    ______________

    Male_0      {'Male'  }    false         26              158              194
    Male_1      {'Male'  }    true          21              164              202
    Female_0    {'Female'}    false         40              111              147
    Female_1    {'Female'}    true          13              115              146
Compute group means for input data in a matrix. Group the input data using one or two grouping variables.
Load the carsmall data set, which contains measurements of 100 cars.
load carsmallCompute group means for the variable Acceleration grouped by the variables Origin and Cylinders. The variable Acceleration is the time from 0 to 60 MPH in seconds. The grouping variable Origin is the country of origin for each car (France, Germany, Italy, Japan, Sweden, or USA). The grouping variable Cylinders has three unique values, 4, 6, and 8, indicating the number of cylinders in each car.
Calculate the mean acceleration grouped by the country of origin.
means = grpstats(Acceleration,Origin)
means = 6×1

   14.4377
   18.0500
   15.8867
   16.3778
   16.6000
   15.5000
means is a 6-by-1 vector of mean accelerations, where each value corresponds to a country of origin.
Calculate the mean acceleration grouped by both the country of origin and number of cylinders. Return the group names along with the mean acceleration for each group.
[means,grps] = grpstats(Acceleration,{Origin,Cylinders}, ...
    ["mean","gname"])
means = 10×1
17.0818
16.5267
11.6406
18.0500
15.9143
15.5000
16.3375
16.7000
16.6000
15.5000
grps = 10×2 cell
    {'USA'    }    {'4'}
    {'USA'    }    {'6'}
    {'USA'    }    {'8'}
    {'France' }    {'4'}
    {'Japan'  }    {'4'}
    {'Japan'  }    {'6'}
    {'Germany'}    {'4'}
    {'Germany'}    {'6'}
    {'Sweden' }    {'4'}
    {'Italy'  }    {'4'}
The two grouping variables Origin and Cylinders have 18 possible combinations because Origin has six unique values and Cylinders has three unique values. Only 10 of the possible combinations appear in the data, so means is a 10-by-1 vector of group means corresponding to the observed combinations of values. The output grps shows the 10 observed combinations of grouping variable values. For example, the mean acceleration of 4-cylinder cars made in France is 18.05.
Compute multiple group summary statistics for input data in a matrix.
Load the carsmall data set, which contains measurements of 100 cars.
load carsmallCompute group summary statistics for the variable Acceleration grouped by the variable Origin. The variable Acceleration is the time from 0 to 60 MPH in seconds, and the grouping variable Origin is the country of origin for each car (France, Germany, Italy, Japan, Sweden, or USA).
Return the minimum and maximum acceleration grouped by the country of origin.
[grpMin,grpMax,grp] = grpstats(Acceleration,Origin, ...
    ["min","max","gname"])
grpMin = 6×1

    8.0000
   15.3000
   13.9000
   12.2000
   15.7000
   15.5000
grpMax = 6×1

   22.2000
   21.9000
   18.2000
   24.6000
   17.5000
   15.5000
grp = 6×1 cell
    {'USA'    }
    {'France' }
    {'Japan'  }
    {'Germany'}
    {'Sweden' }
    {'Italy'  }
The car with the lowest acceleration is made in the USA, and the car with the highest acceleration is made in Germany.
Compute summary statistics for input data in a table. Pass in [] for the grouping variable so that grpstats computes summary statistics without grouping.
Load the patients data set.
load patientsCreate a table that contains the variables Age, Weight, and Smoker.
tbl = table(Age,Weight,Smoker);
The variables Age and Weight have numeric values, and Smoker has logical values.
Compute the mean, minimum, and maximum for the numeric arrays Age and Weight and the logical array Smoker, with no grouping.
tblstats = grpstats(tbl,[],["mean","min","max"])
tblstats=1×10 table
           GroupCount    mean_Age    min_Age    max_Age    mean_Weight    min_Weight    max_Weight    mean_Smoker    min_Smoker    max_Smoker
           __________    ________    _______    _______    ___________    __________    __________    ___________    __________    __________

    All       100         38.28        25         50           154           111           202           0.34          false         true
The observation name All indicates that grpstats uses all observations in tbl to compute the summary statistics.
Compute and plot means and prediction intervals for each group of input data in a matrix.
Load the carsmall data set, which contains measurements of 100 cars.
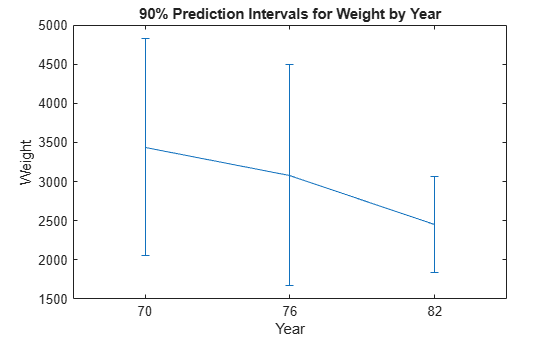
load carsmallCompute group summary statistics for the variable Weight grouped by the variable Model_Year. The variable Weight contains car weight values, and the grouping variable Model_Year has three unique values, 70, 76, and 82, which correspond to the model years 1970, 1976, and 1982.
Calculate the mean weight and 90% prediction intervals for each model year.
[means,pred,grp] = grpstats(Weight,Model_Year, ...
    ["mean","predci","gname"],"Alpha",0.1);
Plot error bars showing the mean weight and 90% prediction intervals grouped by model year. Specify the horizontal tick labels as the group names.
f = figure;
ngrps = length(grp); % Number of groups
errorbar((1:ngrps)',means,pred(:,2)-means)
xlim([0.5 3.5])
f.CurrentAxes.XTick = 1:ngrps;
f.CurrentAxes.XTickLabel = grp;
title("90% Prediction Intervals for Weight by Year")
xlabel("Year")
ylabel("Weight")
Plot group means and confidence intervals for input data in a matrix. Group the input data using one or two grouping variables, and specify one or two variables for which you want to plot the summary statistics.
Load the carsmall data set, which contains measurements of 100 cars.
load carsmallThe variable Acceleration is the time from 0 to 60 MPH in seconds. The grouping variable Cylinders is the number of cylinders in each car.
Plot the mean acceleration grouped by cylinder, with 95% confidence intervals.
grpstats(Acceleration,Cylinders,0.05);
legend("Acceleration")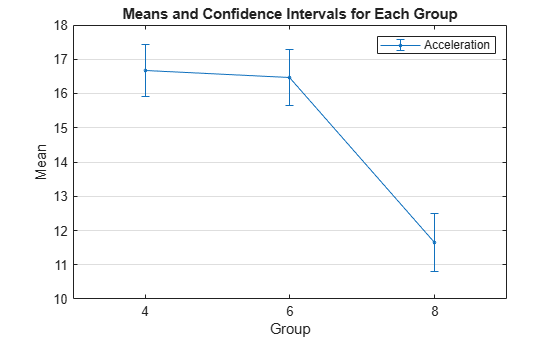
The mean acceleration for cars with 8 cylinders is significantly lower than for cars with 4 or 6 cylinders.
The variable Weight is the weight value for each car. Plot the mean acceleration and weight grouped by cylinder, with 95% confidence intervals. Scale the Weight values by 1000 so the means of Weight and Acceleration are the same order of magnitude.
grpstats([Acceleration,Weight/1000],Cylinders,0.05);
legend("Acceleration","Weight/1000")
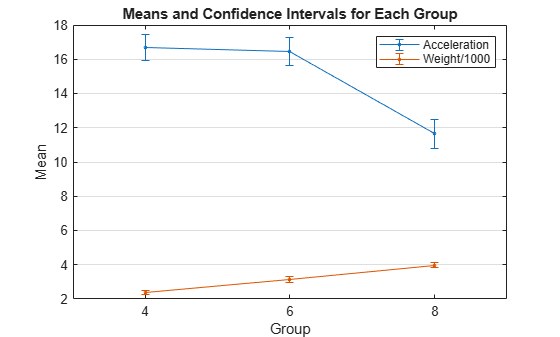
The mean weight of cars increases with the number of cylinders, and the mean acceleration decreases with the number of cylinders.
The Model_Year variable has three unique values, 70, 76, and 82, which correspond to the model years 1970, 1976, and 1982. Plot the mean acceleration grouped by both cylinder and model year. Specify 95% confidence intervals.
grpstats(Acceleration,{Cylinders,Model_Year},0.05);
legend("Acceleration")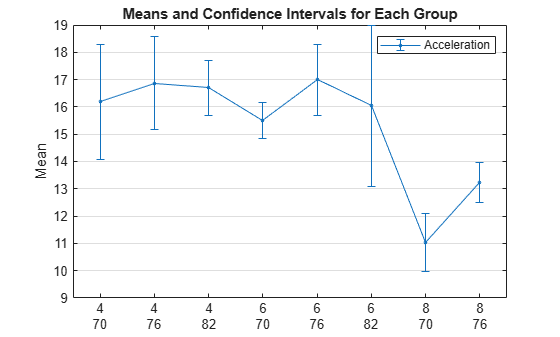
The two grouping variables Cylinders and Model_Year have nine possible combinations of values, because each variable has three unique values. The plot does not show 8-cylinder cars with the model year 1982 because the data does not include this combination.
The mean acceleration of 8-cylinder cars made in 1976 is significantly larger than the mean acceleration of 8-cylinder cars made in 1970.
Define a custom summary statistic by using an anonymous function. Pass the anonymous function to grpstats to compute the custom summary statistic for each group of input data.
Load the patients data set.
load patientsCreate a table that contains the variables Age, Smoker, and LastName.
tbl = table(Age,Smoker,LastName);
Find the number of smokers for each age group by using a custom function that computes the sum of each column of an input matrix.
f_sum = @(x)sum(x,1);
tblstats1 = grpstats(tbl,"Age",f_sum,"DataVars","Smoker", ...
    "VarNames",["Age","Group Count","Number of Smokers"])
tblstats1=25×3 table
          Age    Group Count    Number of Smokers
          ___    ___________    _________________

    25    25          6                 1
    27    27          1                 1
    28    28          5                 2
    29    29          3                 0
    30    30          4                 1
    31    31          4                 2
    32    32          4                 1
    33    33          3                 3
    34    34          1                 0
    35    35          2                 0
    36    36          4                 0
    37    37          5                 2
    38    38          6                 2
    39    39          8                 3
    40    40          4                 1
    41    41          3                 0
      ⋮
tblstats1 is a table with 25 rows corresponding to the unique values in Age. The Group Count column shows the number of observations in each age group, and the last column shows the number of smokers in each group.
Determine the mean length of the last name for each age group by using a custom function that computes the mean length of the elements in a cell array.
f_length = @(x)mean(cellfun("length",x));
tblstats2 = grpstats(tbl,"Age",f_length,"DataVars","LastName", ...
    "VarNames",["Age","Group Count","Mean Length of Last Name"])
tblstats2=25×3 table
          Age    Group Count    Mean Length of Last Name
          ___    ___________    ________________________

    25    25          6                  5.6667
    27    27          1                       6
    28    28          5                     5.4
    29    29          3                  5.6667
    30    30          4                     6.5
    31    31          4                    5.25
    32    32          4                     6.5
    33    33          3                  6.3333
    34    34          1                       9
    35    35          2                     7.5
    36    36          4                    6.25
    37    37          5                     8.2
    38    38          6                  5.8333
    39    39          8                   6.125
    40    40          4                     5.5
    41    41          3                  5.3333
      ⋮
Input Arguments
Name-Value Arguments
Output Arguments
Algorithms
grpstatscomputes summary statistic values for each observed unique value or combination of values in the grouping variables.If you specify a single grouping variable, then the output of
grpstatscontains a row for each observed unique value of the grouping variable.grpstatssorts the groups by order of appearance (if the grouping variable is a character vector or string scalar); in ascending numeric order (if the grouping variable is numeric); or in order of by category (if the grouping variable is categorical).If you specify multiple grouping variables, then the output of
grpstatscontains a row for each observed unique combination of values in the grouping variables. For example, if you specify two grouping variables, each with two values, then the output has four possible combinations of grouping variable values. The function computes summary statistics only for the observed combinations that exist in the input grouping variables (not all possible combinations).grpstatssorts the groups by the values of the first grouping variable, then the second grouping variable, and so on.
grpstatsignores missing values intbl,X, andgroup. Missing values depend on the data type:NaNfordouble,single,duration, andcalendarDurationNaTfordatetime<missing>forstring<undefined>forcategorical' 'forchar{''}forcellof character vectors
Alternative Functionality
MATLAB® includes the function groupsummary, which also returns group summaries and is recommended when
you are working with a table. groupsummary allows you to specify
whether to include groups that consist of missing values and groups with zero elements
in the output. Also, the function supports various group binning schemes and anonymous
functions that require more than one input argument for custom summary
statistics.
Extended Capabilities
Version History
Introduced before R2006a