robustdemo
Interactive robust regression
Syntax
robustdemo

robustdemo(x,y)
Description
robustdemo shows the difference
between ordinary least squares and robust regression for data with
a single predictor. With no input arguments, robustdemo displays
a scatter plot of a sample of roughly linear data with one outlier.
The bottom of the figure displays equations of lines fitted to the
data using ordinary least squares and robust methods, together with
estimates of the root mean squared errors.
Use the right mouse button to click on a point and view its least-squares leverage and robust weight.
Use the left mouse button to click-and-drag a point. The displays will update.
robustdemo(x,y) uses x and y data
vectors you supply, in place of the sample data supplied with the
function.
Examples
The following steps show you how to use robustdemo.
Start the example. To begin using
robustdemowith the built-in data, simply type the function name:robustdemo

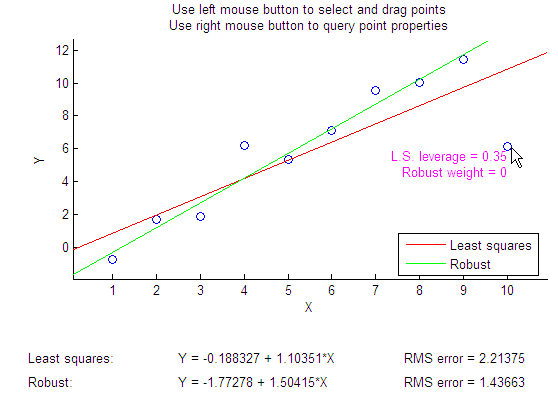
The resulting figure shows a scatter plot with two fitted lines. The red line is the fit using ordinary least-squares regression. The green line is the fit using robust regression. At the bottom of the figure are the equations for the fitted lines, together with the estimated root mean squared errors for each fit.
View leverages and robust weights. Right-click on any data point to see its least-squares leverage and robust weight:

In the built-in data, the right-most point has a relatively high leverage of 0.35. The point exerts a large influence on the least-squares fit, but its small robust weight shows that it is effectively excluded from the robust fit.
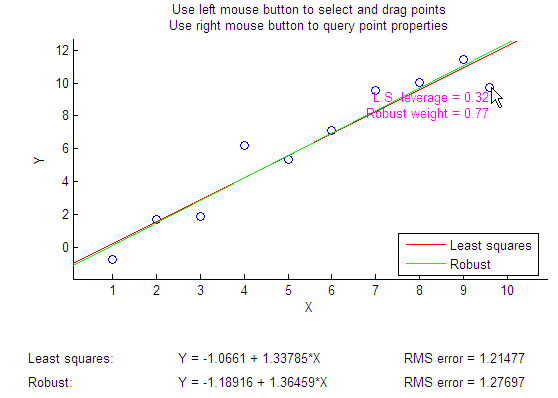
See how changes in the data affect the fits. With the left mouse button, click and hold on any data point and drag it to a new location. When you release the mouse button, the displays update:

Bringing the right-most data point closer to the least-squares line makes the two fitted lines nearly identical. The adjusted right-most data point has significant weight in the robust fit.
Version History
Introduced before R2006a