Visualize Word Embeddings Using Text Scatter Plots
This example shows how to visualize word embeddings using 2-D and 3-D t-SNE and text scatter plots.
Word embeddings map words in a vocabulary to real vectors. The vectors attempt to capture the semantics of the words, so that similar words have similar vectors. Some embeddings also capture relationships between words like "Italy is to France as Rome is to Paris". In vector form, this relationship is .
Load Pretrained Word Embedding
Load a pretrained word embedding using fastTextWordEmbedding. This function requires Text Analytics Toolbox™ Model for fastText English 16 Billion Token Word Embedding support package. If this support package is not installed, then the function provides a download link.
emb = fastTextWordEmbedding
emb =
  wordEmbedding with properties:

     Dimension: 300
    Vocabulary: [1×999994 string]
Explore the word embedding using word2vec and vec2word. Convert the words Italy, Rome, and Paris to vectors using word2vec.
italy = word2vec(emb,"Italy");
rome = word2vec(emb,"Rome");
paris = word2vec(emb,"Paris");
Compute the vector given by italy - rome + paris. This vector encapsulates the semantic meaning of the word Italy, without the semantics of the word Rome, and also includes the semantics of the word Paris.
vec = italy - rome + paris
Find the closest words in the embedding to vec using vec2word.
word = vec2word(emb,vec)
word =
"France"
Create 2-D Text Scatter Plot
Visualize the word embedding by creating a 2-D text scatter plot using tsne and textscatter.
Convert the first 5000 words to vectors using word2vec. V is a matrix of word vectors of length 300.
words = emb.Vocabulary(1:5000);
V = word2vec(emb,words);
size(V)
Embed the word vectors in two-dimensional space using tsne. This function may take a few minutes to run. If you want to display the convergence information, then set the 'Verbose' name-value pair to 1.
XY = tsne(V);
Plot the words at the coordinates specified by XY in a 2-D text scatter plot. For readability, textscatter, by default, does not display all of the input words and displays markers instead.
figure
textscatter(XY,words)
title("Word Embedding t-SNE Plot")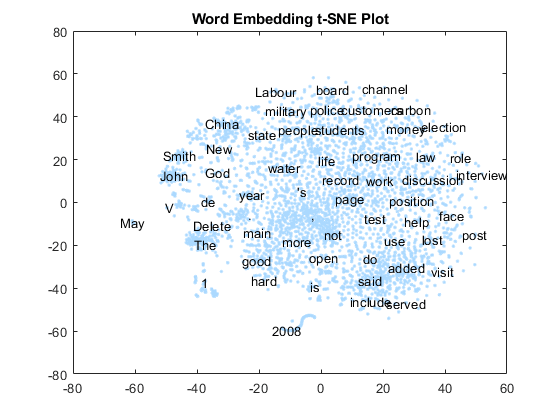
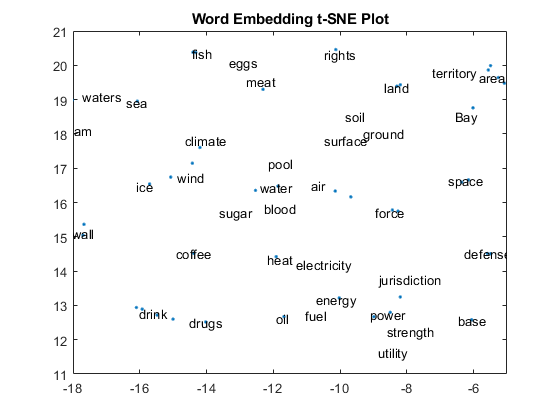
Zoom in on a section of the plot.
xlim([-18 -5])
ylim([11 21])
Create 3-D Text Scatter Plot
Visualize the word embedding by creating a 3-D text scatter plot using tsne and textscatter.
Convert the first 5000 words to vectors using word2vec. V is a matrix of word vectors of length 300.
words = emb.Vocabulary(1:5000);
V = word2vec(emb,words);
size(V)
Embed the word vectors in a three-dimensional space using tsne by specifying the number of dimensions to be three. This function may take a few minutes to run. If you want to display the convergence information, then you can set the 'Verbose' name-value pair to 1.
XYZ = tsne(V,'NumDimensions',3);Plot the words at the coordinates specified by XYZ in a 3-D text scatter plot.
figure
ts = textscatter3(XYZ,words);
title("3-D Word Embedding t-SNE Plot")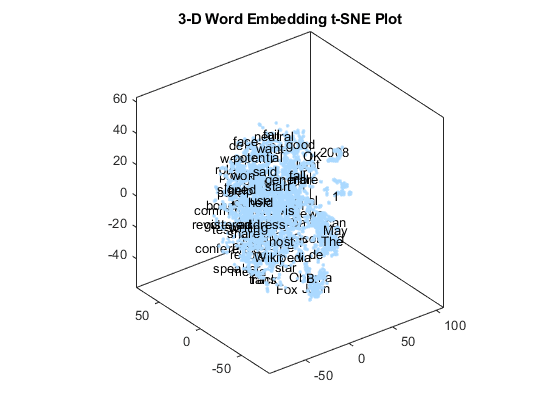
Zoom in on a section of the plot.
xlim([12.04 19.48])
ylim([-2.66 3.40])
zlim([10.03 14.53])

Perform Cluster Analysis
Convert the first 5000 words to vectors using word2vec. V is a matrix of word vectors of length 300.
words = emb.Vocabulary(1:5000);
V = word2vec(emb,words);
size(V)
Discover 25 clusters using kmeans.
cidx = kmeans(V,25,'dist','sqeuclidean');
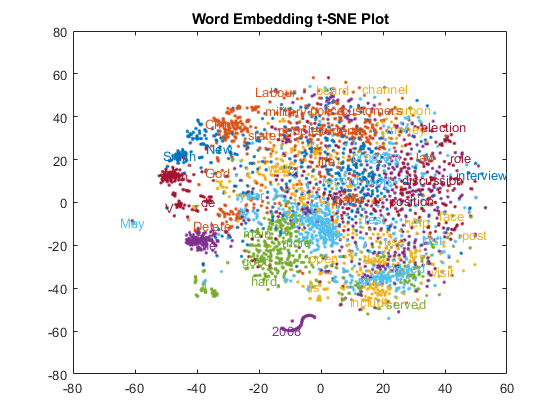
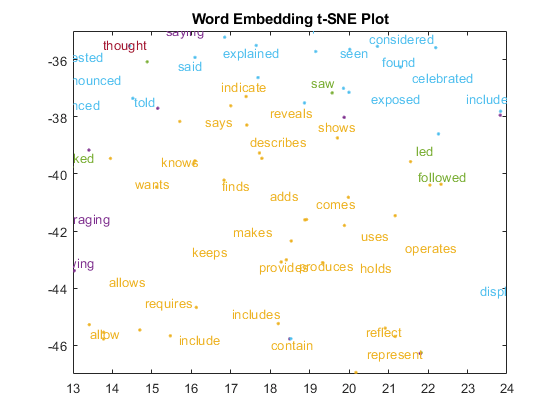
Visualize the clusters in a text scatter plot using the 2-D t-SNE data coordinates calculated earlier.
figure
textscatter(XY,words,'ColorData',categorical(cidx));
title("Word Embedding t-SNE Plot")
Zoom in on a section of the plot.
xlim([13 24])
ylim([-47 -35])
See Also
readWordEmbedding | textscatter | textscatter3 | word2vec | vec2word | wordEmbedding | tokenizedDocument