Visualize Path Traversed in Vector Maps
This example shows how to visualize latitude and longitude data in your ThingSpeak™ channel feed on a map. You can use the vector map provided by the Mapping Toolbox and plot the path traversed by Mary Maersk.
Read Data
ThingSpeak channel 73734 contains the location data of the Mary Maersk ship. Read the location data for the last 10 days using the thingSpealRead function.
data = thingSpeakRead(73734,'DateRange',...
    [datetime('today')-caldays(10),datetime('today')],'outputFormat','table');
Process Raw Data
Process the raw latitude and longitude data before plotting the data on the map. Store the latitude and longitude information in separate variables lat and lon.
lon = data.Longitude;
lat = data.Latitude;
Use the geoquadline function to find the limits of the tightest possible geographic quadrangle that bounds a line connecting vertices with geographic coordinates specified by lat and lon.
[latlim,lonlim] = geoquadline(lat,lon);
To make the map more easily readable, expand latitude and longitude limits by 10 units using the function bufgeoquad.
buf = 10;
[latlim,lonlim] = bufgeoquad(latlim,lonlim,buf,buf);
Retrieve Vector Map
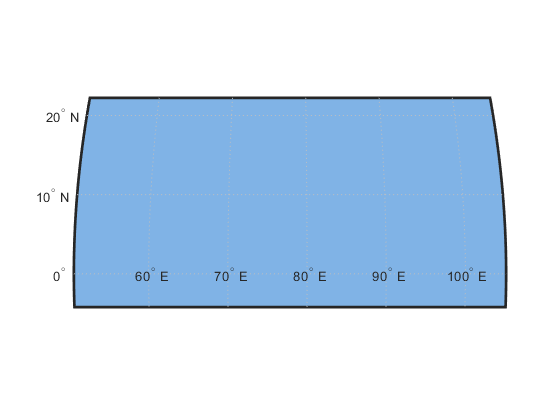
Retrieve the vector map provided by the worldmap function for the region of interest. Also, define the color of the ocean to differentiate between ocean and land mass.
ax = worldmap(latlim,lonlim);
oceanColor = [.5 .7 .9];
setm(ax, 'FFaceColor',oceanColor);
Generate the Map
Use the vector map returned by the worldmap function to generate a plot of the path travelled by the Mary Maersk ship over the last 10 days. Load and use the coastlines data to mark the edge of each continent.
load coastlines;
geoshow(lat,lon,'Color','k');
hold on;
geoshow(coastlat,coastlon,'FaceColor','yellow','DisplayType','polygon');
title('Polygon Geographic Vector Data');
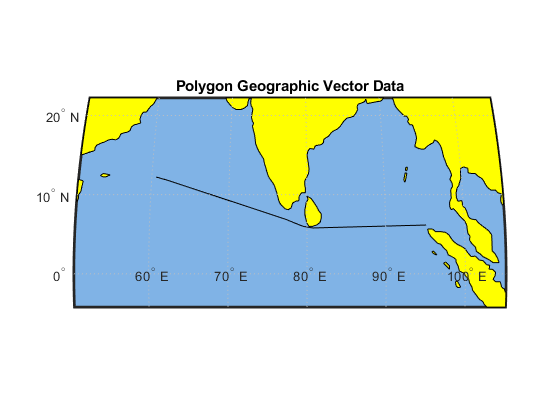
The vector map shows where the Mary Maersk has travelled in the last 10 days.
See Also
Functions
geoquadline(Mapping Toolbox) |bufgeoquad(Mapping Toolbox) |worldmap(Mapping Toolbox) |geoshow(Mapping Toolbox) |thingSpeakRead