Using Wavelet Image Analyzer App
You can use Wavelet Image
Analyzer to visualize the discrete wavelet and continuous wavelet
decompositions of indexed and truecolor (RGB) images. For both transform types, you can
export the image decompositions to the workspace. You can also generate MATLAB® scripts to reproduce results in your workspace. Images can be of data type
single, double, uint8, or
uint16. For more information on truecolor images, see Working with Image Types in MATLAB.
Transforms
| Transform | Supported Wavelets | Visualization | Related Functions |
|---|---|---|---|
| 2-D Discrete Wavelet Transform (DWT) |
Orthogonal Wavelet Families
Biorthogonal Wavelet Family
|
| wavedec2,
waverec2 |
| 2-D Continuous Wavelet Transform (CWT) | An Isotropic wavelet is not sensitive to the orientation of features. An Anisotropic wavelet is sensitive to the orientation. Isotropic
Anisotropic
|
| cwtft2,
cwtftinfo2 |
Working With Scenarios
The app lists all image decompositions, or scenarios, in the Scenarios pane. From the Analyzer tab, you can:
Import an image from the workspace or file system.
Add a new decomposition.
Duplicate or delete an existing decomposition.
Export a decomposition to your workspace.
Generate a MATLAB script to reproduce results in your workspace.
Tab Sections
File — Click New Session to clear all scenarios from the current session. To load an image into the app, click Import. If scenarios exists when you click either button, the app gives you the opportunity to cancel the action.
Decomposed Images — To obtain a different type of wavelet composition, click Add, and select a decomposition type. The app generates the decomposition using default parameters. To duplicate the selected scenario, click Duplicate. When you duplicate a scenario, all wavelet parameters associated with the original scenario are preserved. To remove a scenario, click Delete.
Export — To export results to the workspace, or generate a script to reproduce results, choose the appropriate item from the Export drop-down list.
To rename a scenario, double-click its name in the Scenarios pane, and type the new name.

Interacting with Decomposition Images
To hide all the plots in a row or column in the Decompositions pane, right-click a plot in that row or column and select the desired action. You can restore all plots, right-click anywhere in the Decompositions pane and select Show all levels and subbands.
Example: Visualize Discrete Wavelet Decomposition
This example shows how to import an image into the Wavelet Image Analyzer app and visualize its discrete wavelet decomposition.
Read the honey badger image into the workspace. The image is in the same folder as this example file.
honey = imread("honeybadger.jpg");Open Wavelet Image Analyzer.
On the Analyzer tab, click Import to open the Import Images dialog box. The dialog box lists all the workspace variables the app can process, along with their dimensions.
Select
honeyand click Import.
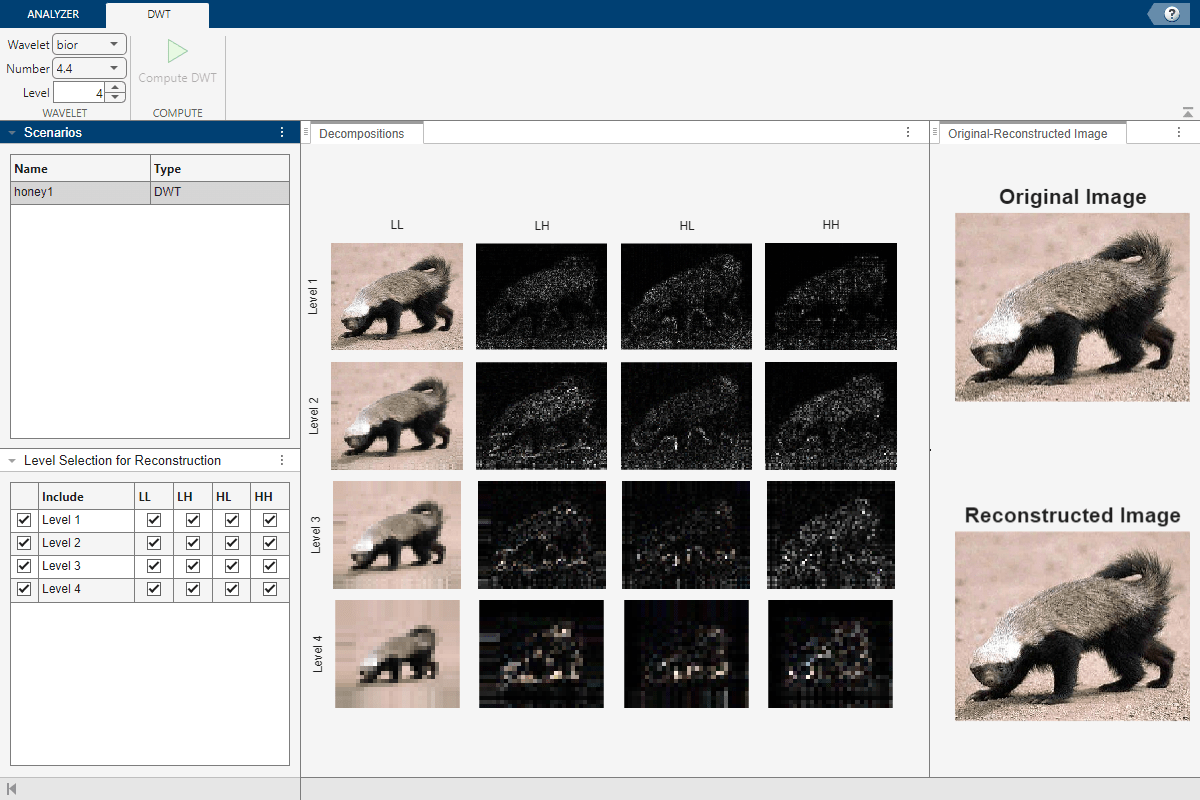
A four-level discrete wavelet transform (DWT) decomposition of the image appears. By default, the app decomposes the image using the biorthogonal bior4.4 wavelet, which has four vanishing moments each for the decomposition and reconstruction filters. The app names the decomposed image honey1 in the Scenarios pane. The original image, honey, and the reconstruction, honey1, are plotted in the Original-Reconstructed Image pane. The app switches to the DWT tab.
The column titles in the Decompositions pane refer to the approximation (LL) coefficients and details in three orientations: horizontal (LH), vertical (HL), and diagonal (HH). The order of the pair of letters L and H indicates the order in which the app applies the lowpass (L) scaling and highpass (H) wavelet filters to obtain the decomposition at successive levels. For more information about the 2-D DWT algorithm, see wavedec2.
To specify which coefficients to use to reconstruct the image, select the corresponding check boxes in the Level Selection for Reconstruction pane. The Original-Reconstructed Image pane shows the original and reconstructed images.
To generate a new decomposition, change any of the wavelet parameters in the DWT tab. Changing a parameter enables the Compute DWT button.
For more information, see Generate DWT Decomposition Using Wavelet Image Analyzer and Share Results.