Wavelet Decomposition of Complex-Valued Signal Using Wavelet Signal Analyzer
Load the NPG2006 dataset. Extract the complex-valued signal from the npg2006 structure array.
load npg2006
npgdata = npg2006.cx;
Open Wavelet Signal Analyzer and import the signal into the app. A four-level nondecimated wavelet decomposition of the signal appears. By default, the app plots the real and imaginary parts of the decomposition and reconstruction.

View Histogram
Show the histogram of the level 3 coefficients. On the Analyzer tab, in the Statistics section, click the arrow to open the gallery. Under By Level, click Histogram. Set the histogram level to the third level. Because the decomposition is complex valued, the app shows separate histograms of the real and imaginary parts of the coefficients.

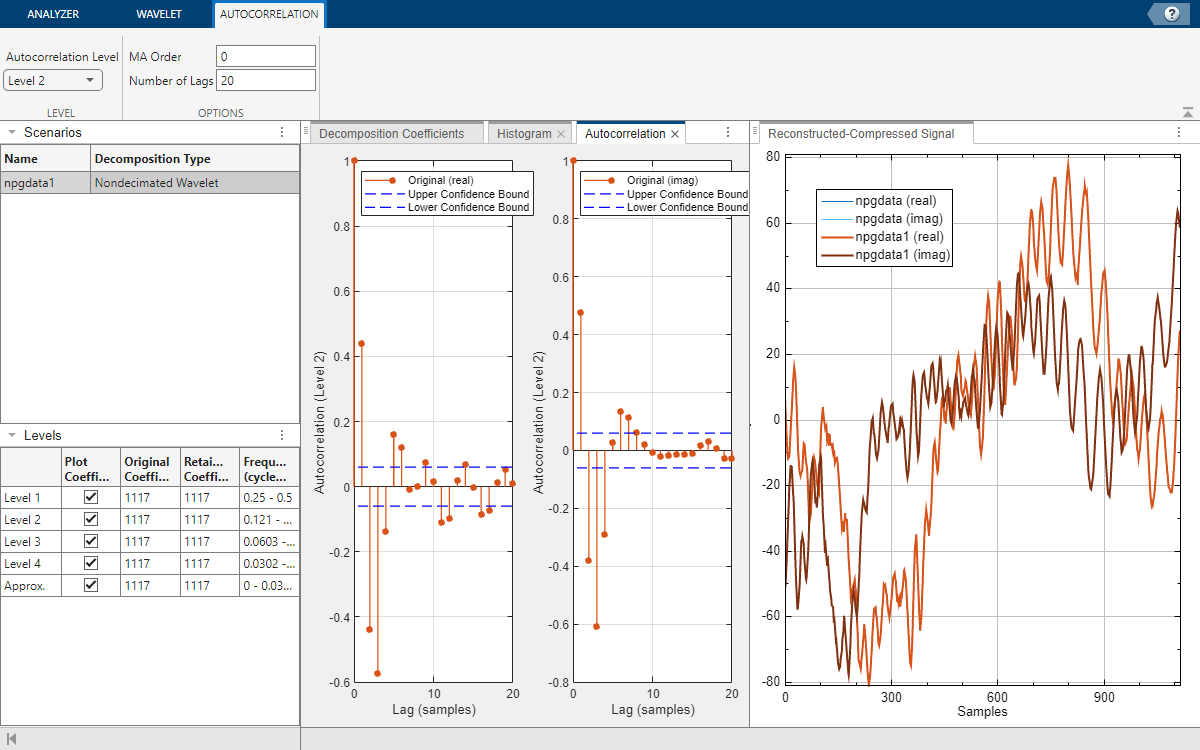
View Autocorrelation
Display the autocorrelation of the coefficients at level 2. On the Analyzer tab, in the Statistics section, click the arrow to open the gallery. Under By Level, click Autocorrelation. Set the autocorrelation level to the second level.
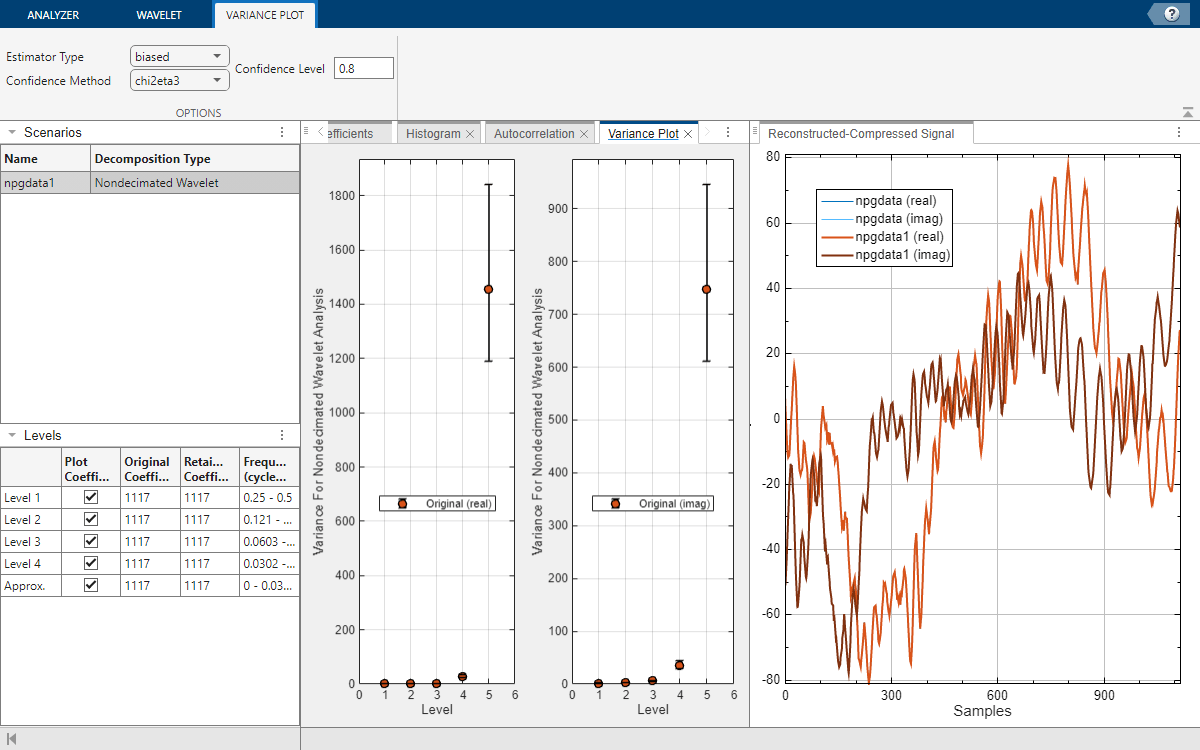
View Variances
Display the variances of the coefficients. In the Statistics section of the Analyzer tab, click the arrow to open the gallery. In the For All Levels group, click Variance Plot. By default, the app plots the unbiased estimates of the wavelet variances in the Variance Plot pane. The plot includes the 95% confidence intervals. Specify the biased estimator and a confidence interval of 80%. For complex-valued data, the app computes the variances of the real and imaginary parts of the decomposition coefficients separately.
Note: The app only supports variance plots of nondecimated wavelet decompositions.
Compress Signal
Enable compression by clicking Compress in the Analyzer tab. For complex-valued signals, you apply thresholds to the coefficient magnitudes.
View the sorted magnitudes of the coefficients.
Specify a global threshold of 30. The app sets the coefficients whose magnitudes are in the interval [-30, 30] to 0.
View the thresholded coefficients.
View only the real part of the original and compressed signals.
