App-Based Generation and Analysis of WLAN Waveform
R2026bThis example shows how to generate and analyze an IEEE® 802.11be™ waveform by using the WLAN Waveform Generator and WLAN Waveform Analyzer apps, respectively.
Generate and Visualize IEEE 802.11be Waveform
Create a 40 MHz multiuser multiple-input multiple-output (MU-MIMO) configuration for extremely high throughput (EHT) with three users, and set parameters common to all users.
Open WLAN Waveform Generator App
On the Apps tab of the MATLAB® Toolstrip, under Wireless Communications, select WLAN Waveform Generator. This opens the Wireless Waveform Generator app configured for WLAN waveform generation.
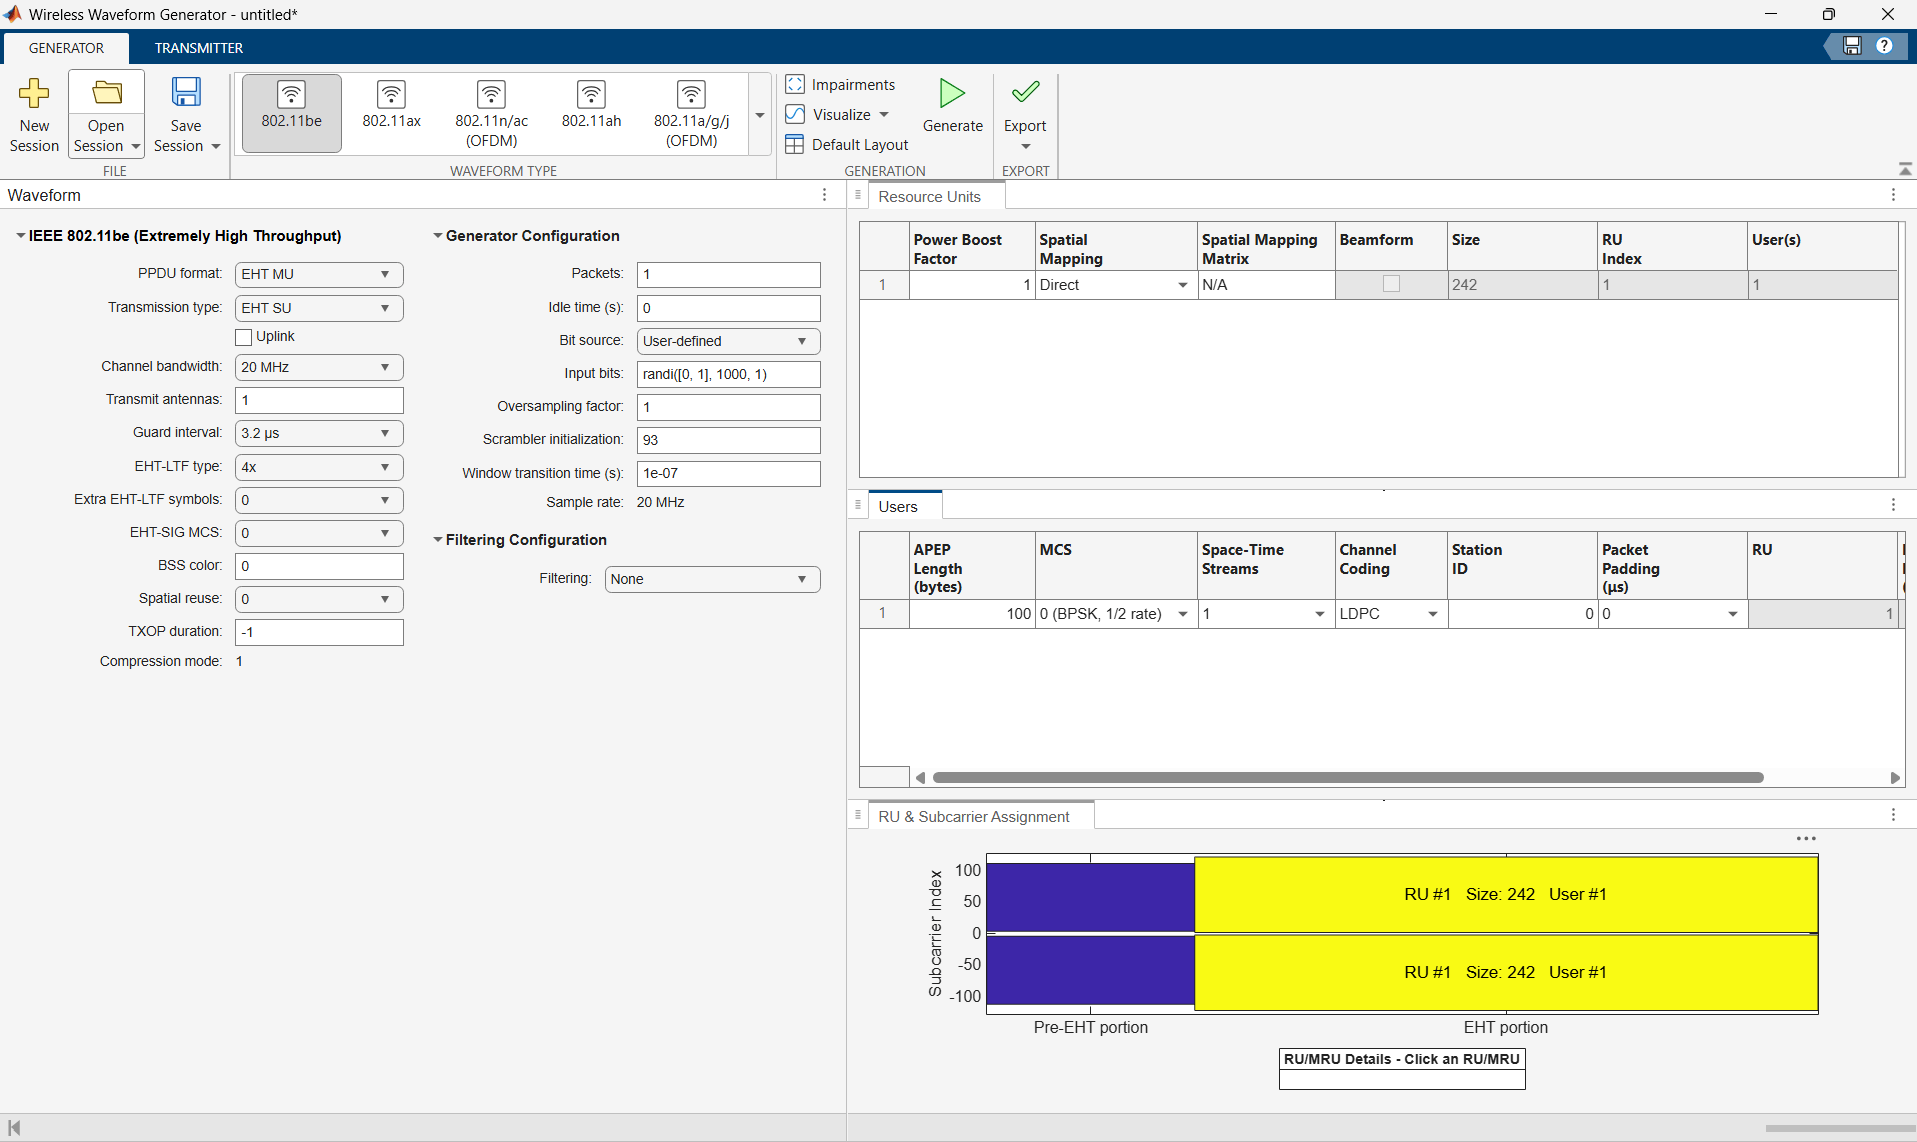
Select PHY Format
In the Waveform Type section of the app toolstrip, select 802.11be to set the PHY format for waveform generation to IEEE 802.11be.
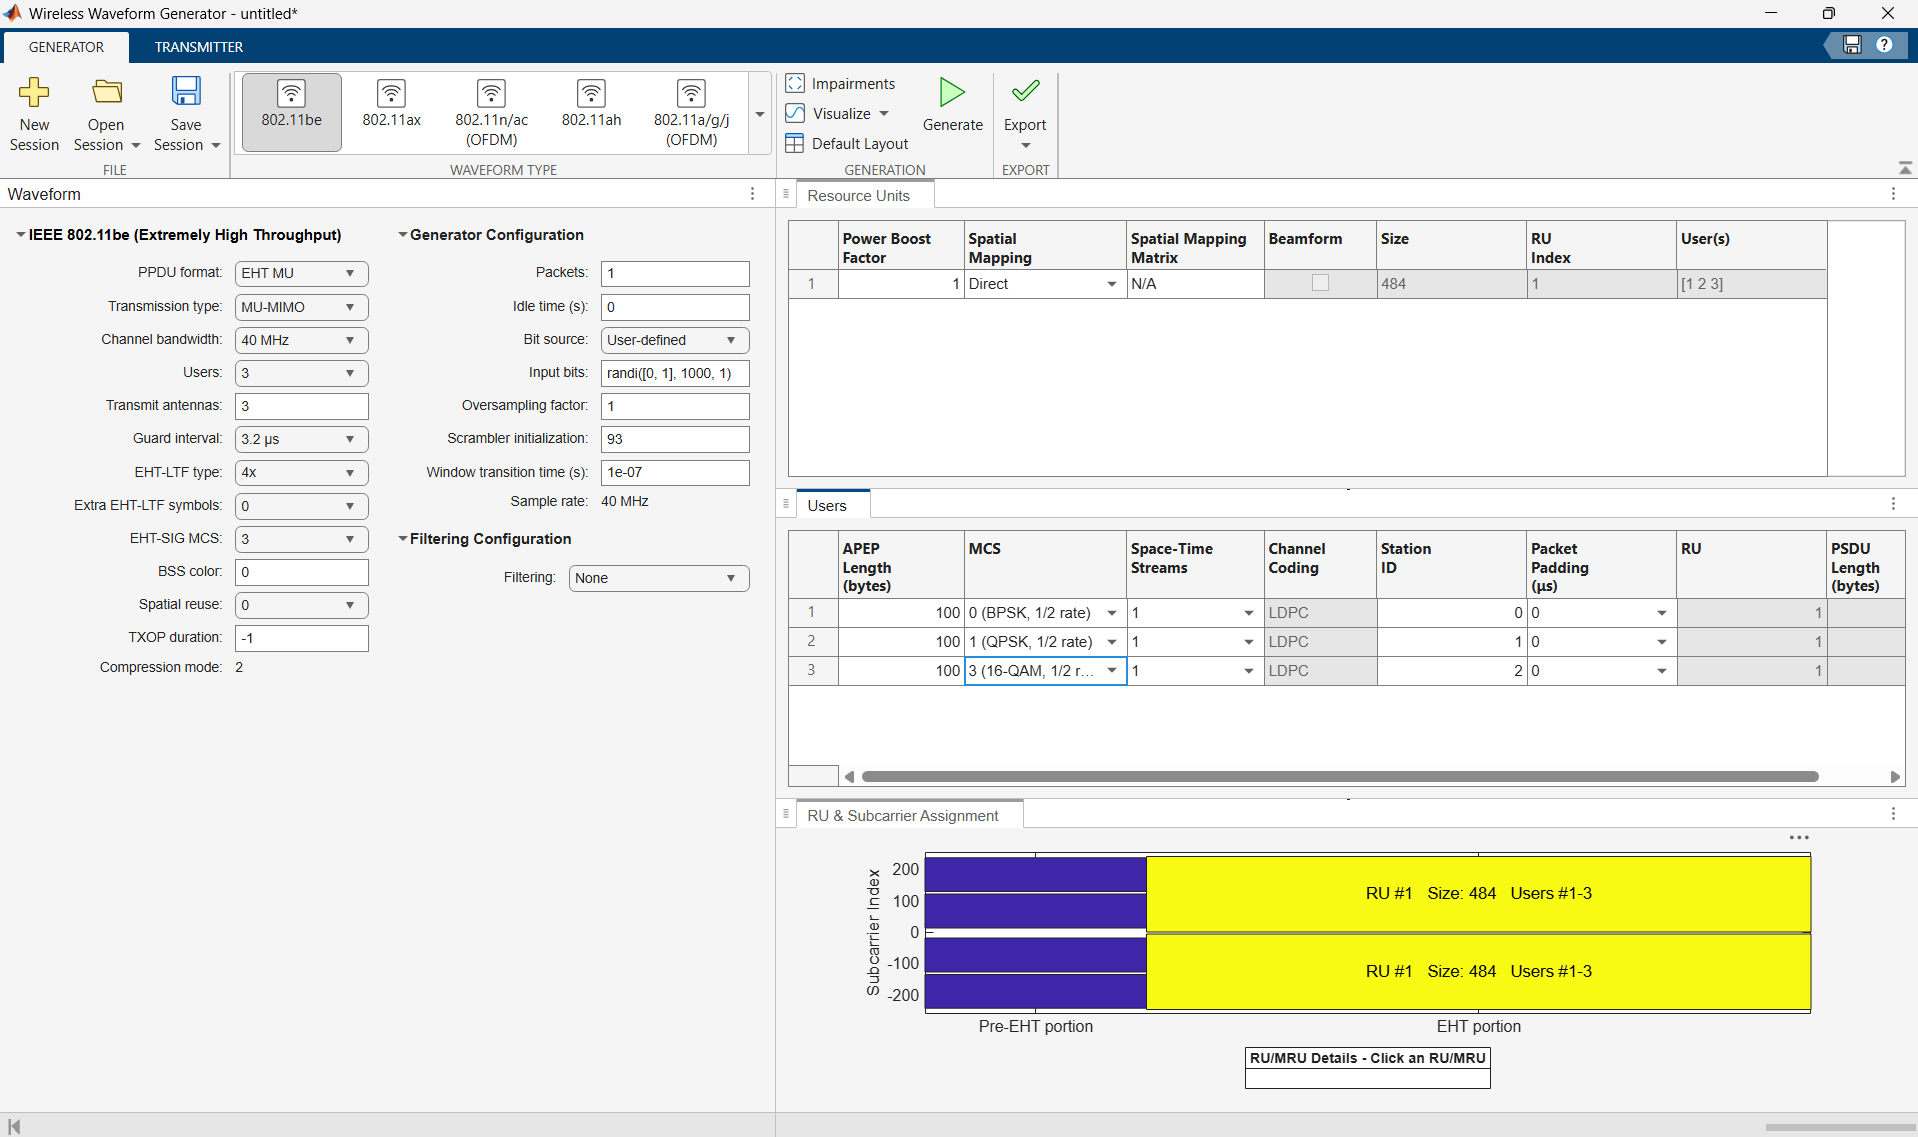
Set Transmission Parameters
In the Waveform pane, set these transmission parameters:
Transmission type —
MU-MIMOChannel bandwidth —
40MHzGuard interval —
3.2μsEHT-SIG MCS —
3
In the Users pane, you can customize the modulation and coding scheme (MCS) for each individual user. In the MCS column of the table, selects 0 (BPSK,1/2 rate) for the first user, 1 (QPSK,1/2 rate) for the second user, and 3 (16-QAM,1/2 rate) for the third user.
Add Impairments to Waveform
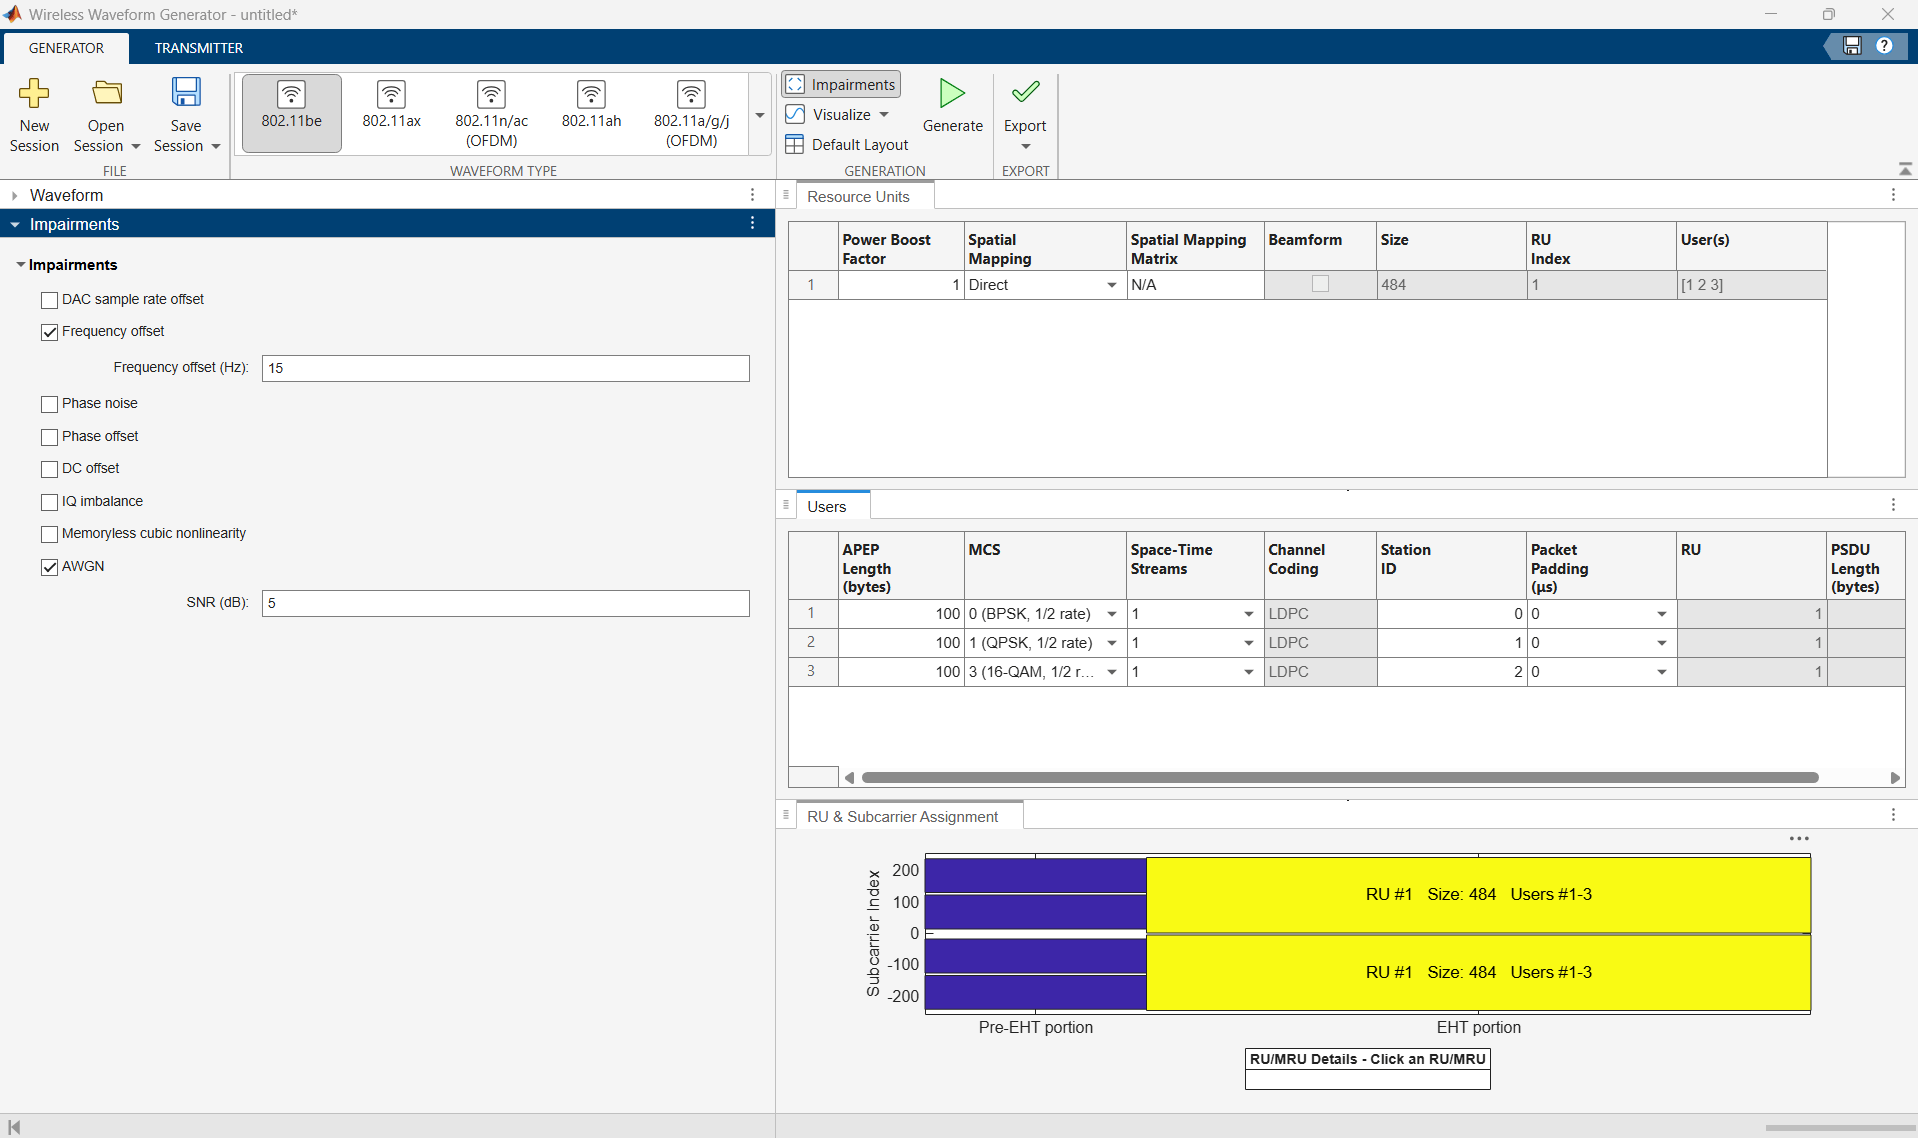
To simulate real-world conditions, add impairments to the waveform. In the Generation section of the app toolstrip, select Impairment. Then, in the Impairment pane**, select AWGN to introduce additive white Gaussian noise (AWGN) to the waveform,** and set its signal to noise ratio (SNR) value to 5 dB by specifying SNR (dB) as 5. Then, select Frequency offset and set Frequency offset (Hz) to 15 to simulate slight variations in the carrier frequency, mimicking a real-world signal.
Generate and Visualize Waveform
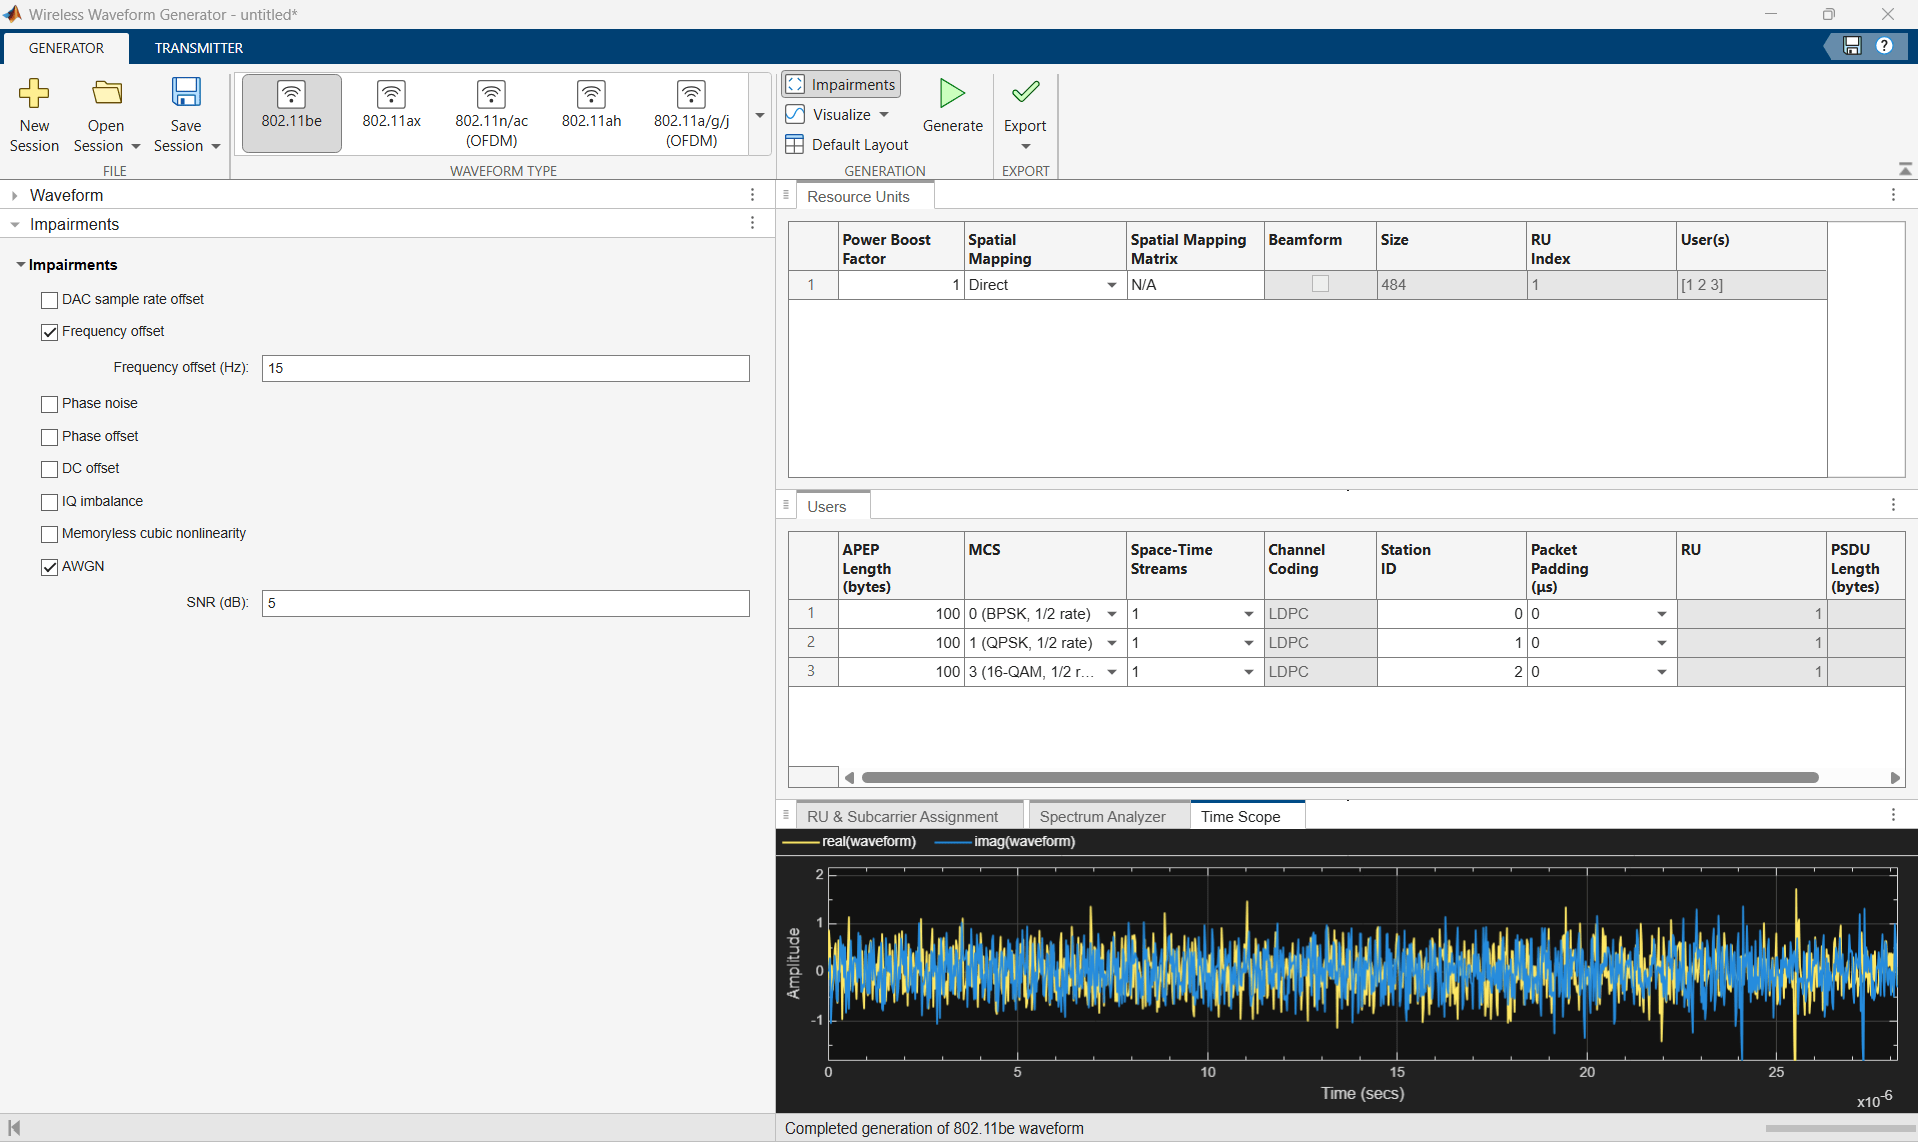
In the Generation section of the app toolstrip, click Visualize and select Time Scope and Spectrum Analyzer. Visualize the waveform by selecting Generate. The lower-right pane shows the selected visualizations on individual tabs.
Export Generated Waveform
Save the waveform to a MAT file by selecting Export, then Export to File, and select Export to MAT file, with metadata.
Analyze Generated Waveform
Next, analyze your generated waveform by using the WLAN Waveform Analyzer app.
Open WLAN Waveform Analyzer App
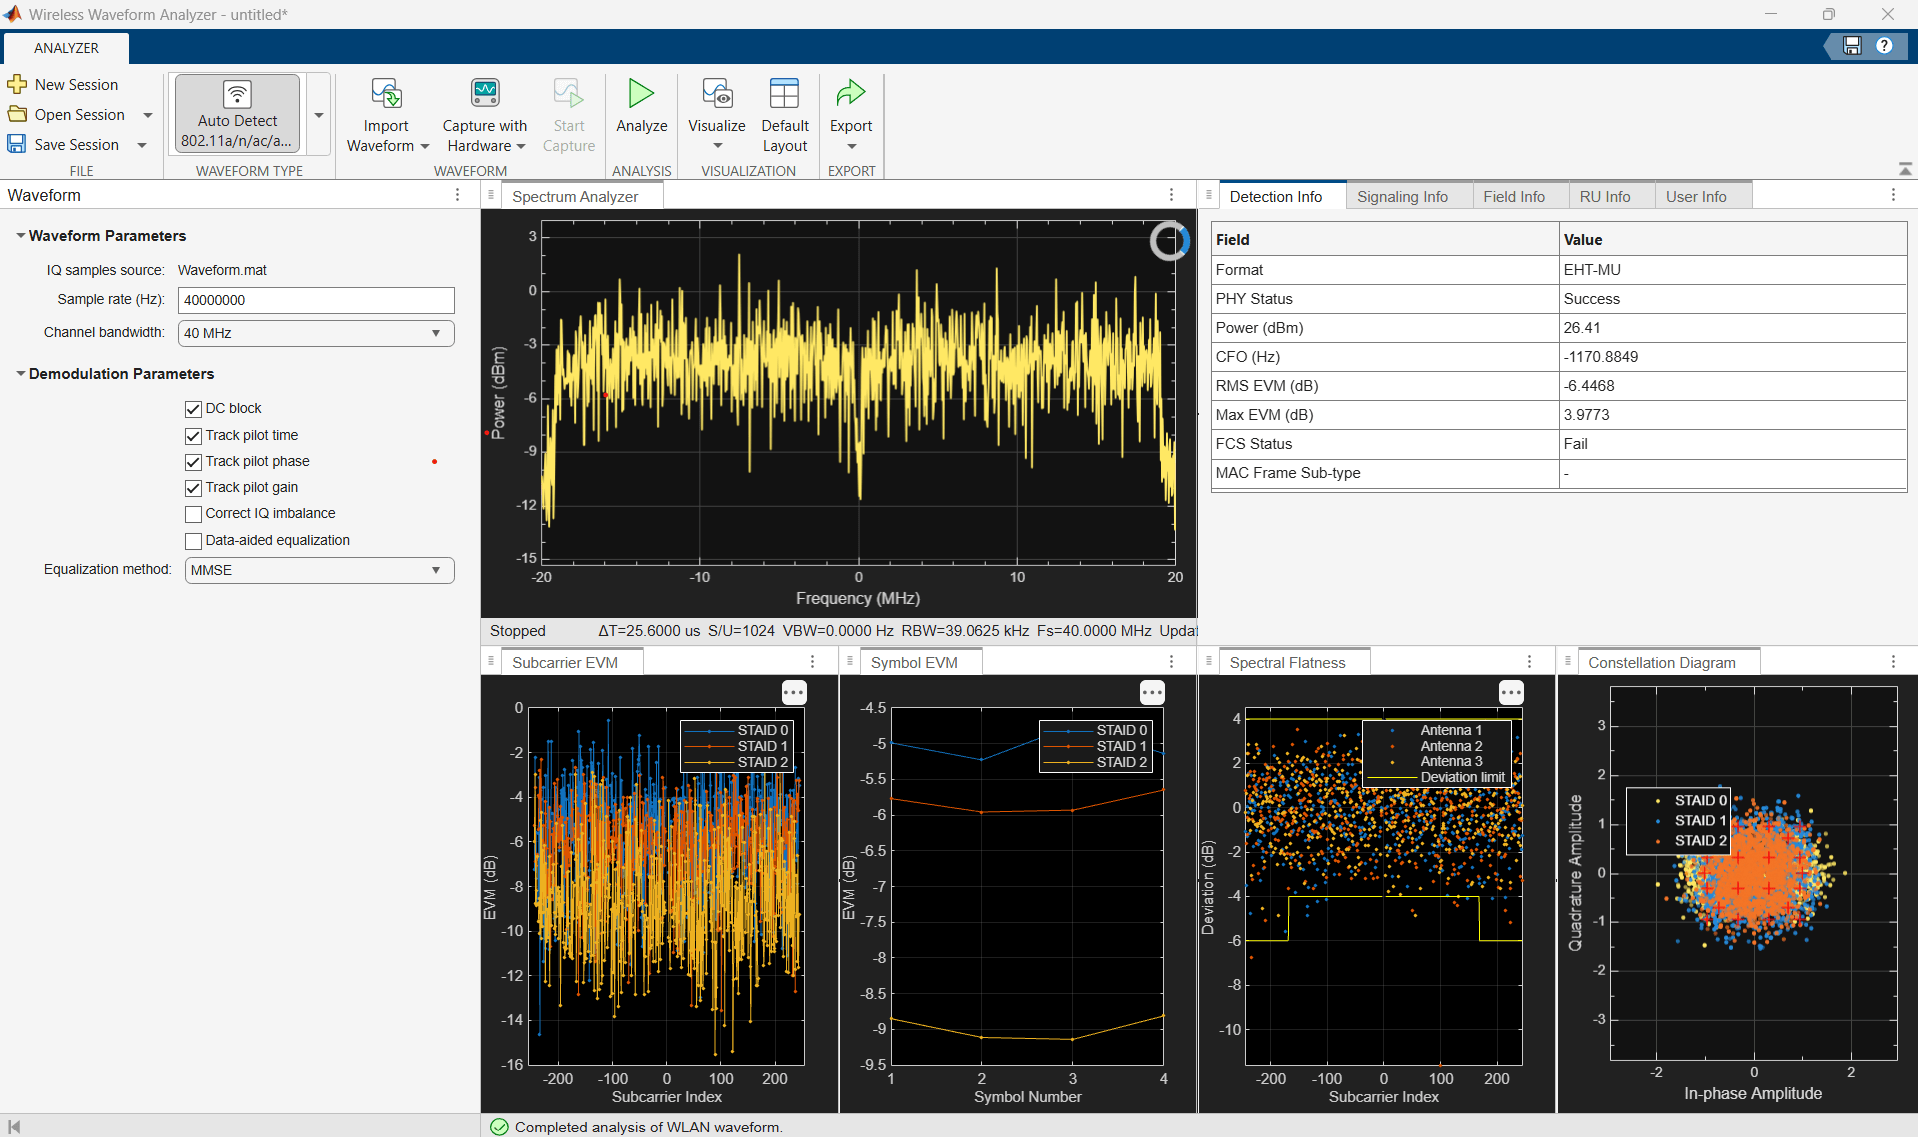
On the Apps tab of the MATLAB Toolstrip, under Wireless Communications, select WLAN Waveform Analyzer. This opens the Wireless Waveform Analyzer app configured for WLAN waveform analysis.
Import Generated Waveform
To import a waveform, click Import Waveform in the Waveform section of the app toolstrip, then select Import from File or Import from Workspace. You can use the WLAN Waveform Generator app to create WLAN waveforms, and then export them to a .bb file, .mat file, .txt file, or a workspace variable.
If you import from a file, you can use a MAT file containing either a waveform variable or a structure of form
struct('waveform',waveform,'fs',fs). You can also import a .bbfile generated by the WLAN Waveform Generator app, or a.txtfile containing in-phase and quadrature (IQ) data.If you import from the workspace, you can either import a workspace variable of data type
singleordouble, or a workspace variable that is a structure of formstruct('waveform',waveform,'fs',fs).
Once you import the waveform, the app lists out the IQ sample source and sample rate in the Waveform Parameters pane. If you select a file that does not contain sample rate information, update Sample rate (Hz) manually. Additionally, regardless of the imported waveform, you must always manually update Channel bandwidth. The value of Channel bandwidth must be less than or equal to the value of Sample rate. This requirement satisfies the Nyquist sampling criterion for accurate signal analysis.
Set Demodulation Parameters
In the Demodulation Parameters section of the Waveform pane, set the relevant parameters.
By default, the DC block, Track pilot time, Track pilot phase, and Track pilot gain parameters are enabled.
Analyze and Visualize Results
On the app toolstrip, select Analyze. You can choose from a range of visualization options such as a spectrum analyzer, time scope, constellation diagram, spectral flatness plot, and various error vector magnitude (EVM) plots from the Visualize drop-down button on the app toolstrip.
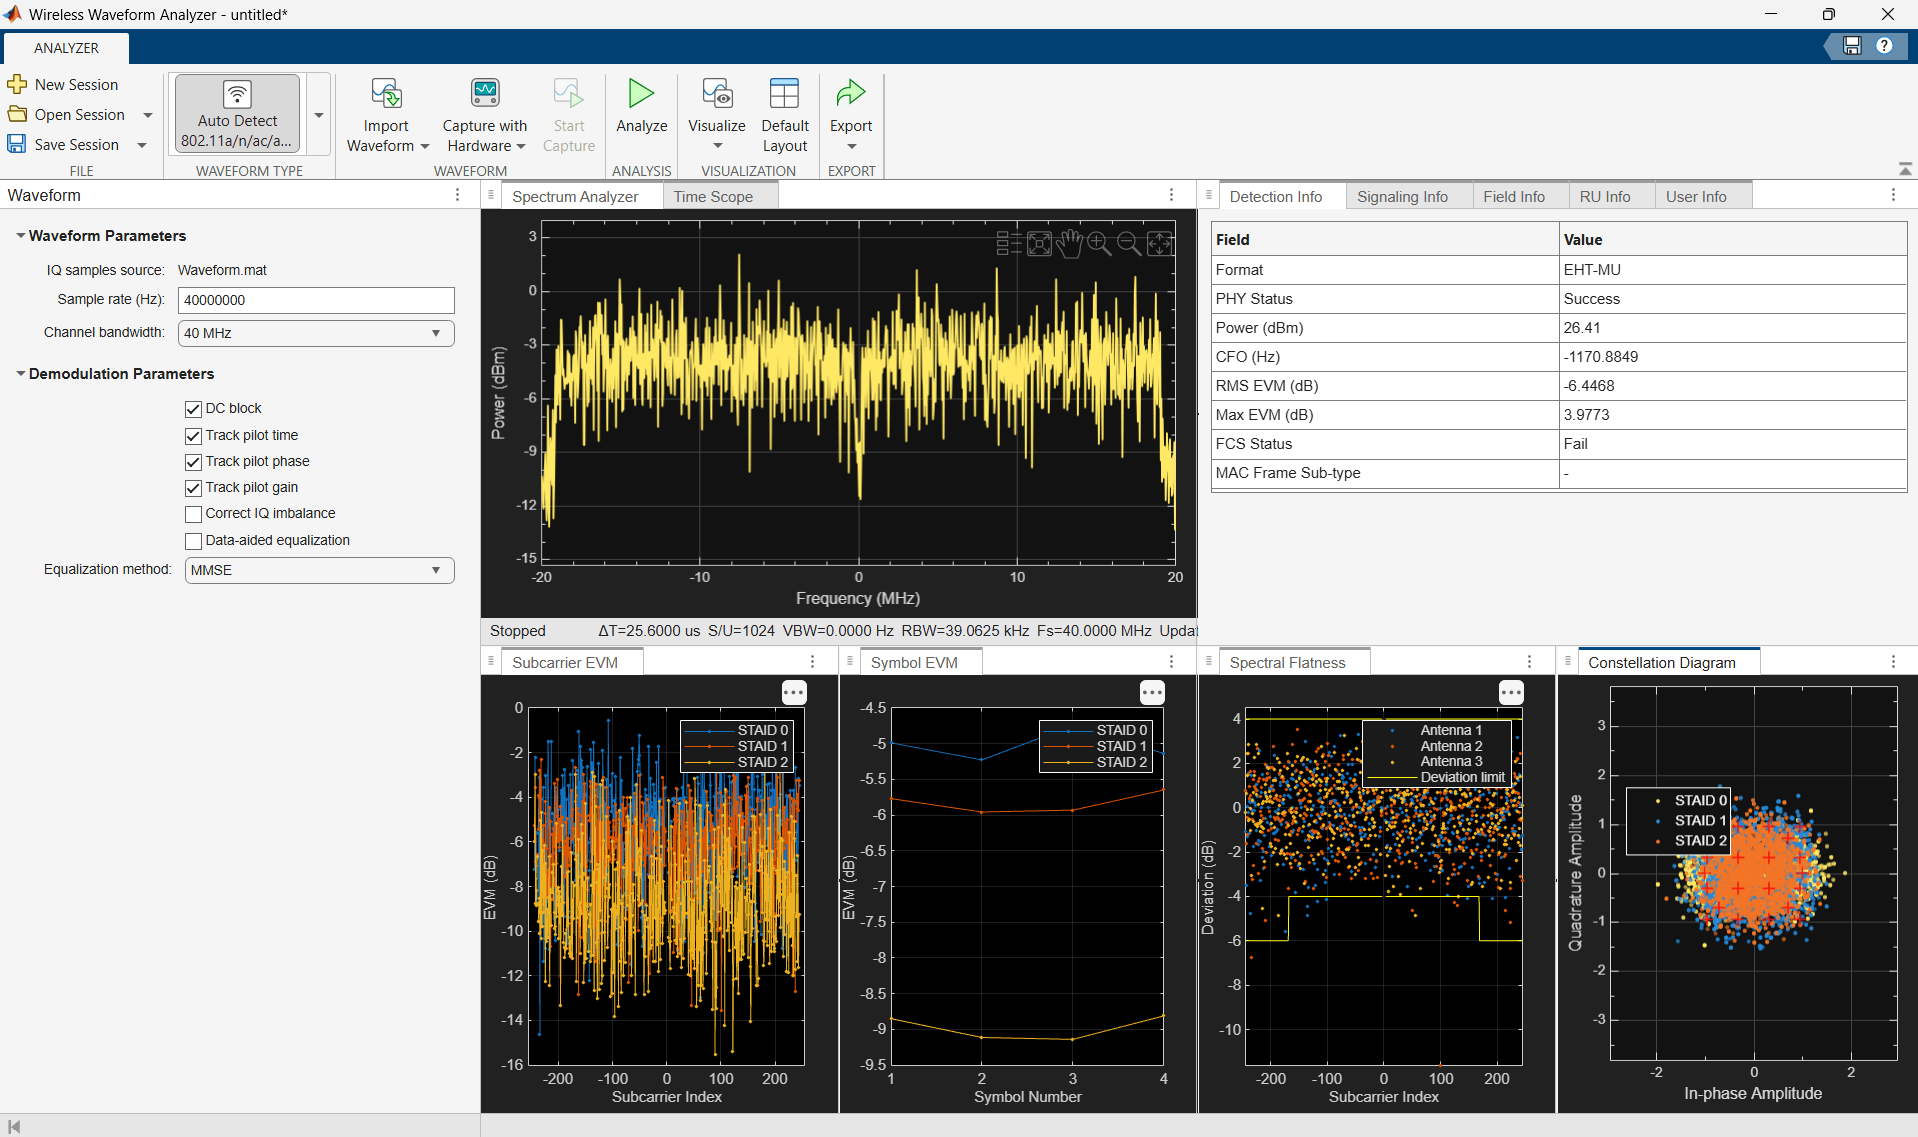
In the top-right pane, select Detection Info tab. The table on this tab shows the detected PHY format, channel bandwidth, packet information, and other waveform characteristics identified by the app.
Export Post-Simulation Results
On the app toolstrip, click the top part of the Export button to export the post-simulation results to the MATLAB workspace. If you click the bottom part of the Export button, you can choose to export the post-simulation results to either a workspace variable or a MAT file.

