This go-to guide is for engineers who want to design and deploy algorithms to detect anomalies in time series data.
Introduction to Anomaly Detection
What Is Anomaly Detection?
Anomaly detection is the process of identifying events or patterns in data that differ from expected behavior. These deviations, known as anomalies, can indicate important information like machine faults, security breaches, early warning signs, or process inefficiencies.
Industrial machinery anomalies are detected from vibration signals. The three-axis vibration data from a time window is processed and anomalies are detected by a machine learning model. The model decision boundary is displayed on a principal component plane, where red dots indicate anomalies.
Example Anomaly Detection Use Cases
Anomaly detection algorithms are useful in various industries and applications:

Predictive Maintenance: Anomaly detection algorithms deployed in industrial equipment can identify early signs of machine failure, improving safety and avoiding costly downtime.

Digital Health: Detecting anomalies in electrocardiogram (ECG) signals can reveal various cardiac conditions, such as arrhythmias, atrial fibrillation, and ventricular tachycardia.

Flight Test Data Analysis: Engineers rely on flight tests to understand system behavior and inform design choices. Anomaly detection can flag erratic sensor values and identify test conditions that fall outside the expected performance range.

Fault-Tolerant Controls: Embedded anomaly detection algorithms in an electric motor can flag changes in real time. This enables the controller to adjust the response to prevent damage and improve performance.
Types of Anomalies in Time Series Data
Although anomalies can appear in various types of data, such as image, video, and text, this guide focuses on time series data, which is prevalent in engineering applications. Time series data records sequential measurements, such as temperature, pressure, and vibration, over time. There are three main types of anomalies in time series data.
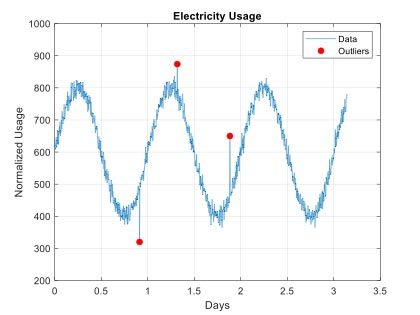
Point anomalies, or outliers, are individual data points that deviate from the expected value.
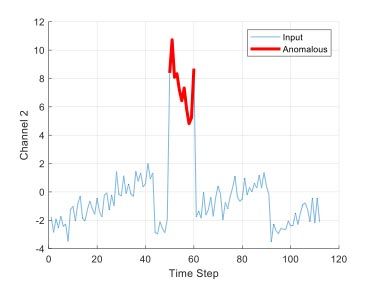
Collective anomalies occur when a group of data points together deviate from expected patterns.
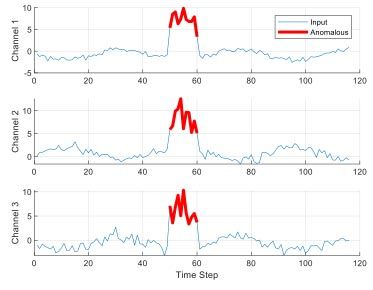
Multivariate anomalies are anomalies that occur when analyzing multiple data sources together and may or may not be anomalies in a single data source.
Choosing an Anomaly Detection Algorithm
MATLAB provides a broad range of time series anomaly detection algorithms that fall into two major categories: statistical and distance-based methods and one-class AI models. These are all possible tools you can use when designing anomaly detection algorithms, but which tool to choose depends on your data and goals.
Statistical and Distance-Based Methods
Statistical methods rely on assumptions about the underlying data distribution. They apply thresholds, trends, or probability models to identify points that deviate from expected statistical behavior. A simple statistical anomaly detection approach might be computing the moving mean of a signal and flagging an anomaly when the mean exceeds a certain threshold.
Distance-based methods do not assume a particular data distribution; instead, they flag anomalies by calculating distances between individual observations or subsequences, identifying those that are far from typical patterns. For example, matrixProfile compares each subsequence in a time series and identifies anomalies as those that are the furthest distance from the others.
Using distanceProfile to identify anomalies in time series data.
When to use Statistical and Distance-Based Methods:
- You have limited training data
- You understand the baseline statistics and trends in your data well
- You have limited compute resources
Characteristics:
+ Simple and interpretable
+ Low computational cost
+ Suitable for point and collective anomalies
- May struggle with complex patterns or nonlinear dynamics
- Sensitive to noise and data dimensionality
Example techniques in MATLAB:
isoutlier– Find outliers in datafindchangepts– Find abrupt changes in signalrobustcov– Compute robust multivariate covariance and mean estimatemahal– Compute Mahalanobis distance to reference samplesdistanceProfile– Compute distance profile between query subsequence and all other subsequences of a time seriesmatrixProfile– Compute matrix profile between all pairs of subsequences in a multivariable time series

Explore an example
Detect anomalies in motor data using matrix profile
Matrix profile is useful for efficiently detecting collective anomalies in long time series. This example shows how to apply matrix profile to detect anomalies in armature current measurements collected from a degrading DC motor.
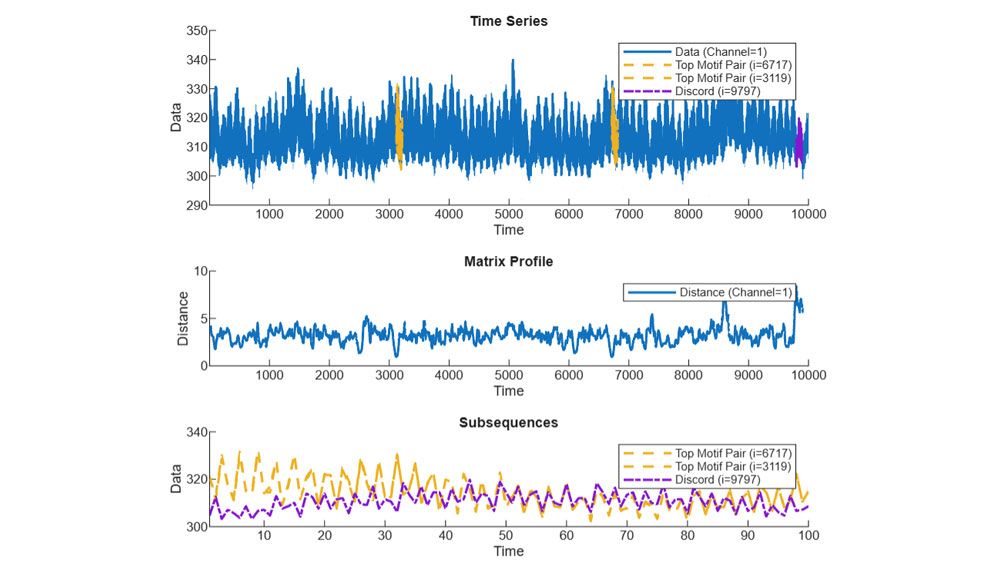
Matrix profile of motor data with top motif pair and discord segments highlighted
One-Class AI Models
Anomaly detection methods in this category train a machine learning or deep learning model on a set of mostly normal baseline data. The model learns normal behavior and identifies deviations as anomalies. One-class AI models work best when anomalies are rare or lack a well-defined pattern. They can be applied across multiple channels of data for all types of anomalies.
When to use One-Class AI Models:
- You want to train a model to identify anomalies in new data as it arrives
- You have a lot of normal data for training
- Anomalies are rare, unknown, or lack a well-defined pattern
Characteristics:
+ Suitable for all types of anomalies, including complex and nonlinear patterns
+ Robust to noise and data dimensionality
+ Deep learning methods do not require feature engineering
- Longer training time and computational requirements
- Often less interpretable than statistical and distance-based methods
Example techniques in MATLAB:
iforest– Isolation forestocsvm– One-class support vector machinerccforest– Robust random cut forestdeepSignalAnomalyDetector– Deep learning models based on 1D convolutional autoencoder or long short-term memory network (LSTM)tcnAD– Temporal convolutional network (TCN)deepantAD– Convolutional neural network (CNN)usAD– Dual-encoder networkvaelstmAD– Variational autoencoder and LSTM

Explore an example
Train deep learning models to detect anomalies
This example uses a deep learning model to detect abnormal heartbeat sequences in electrocardiogram (ECG) data.
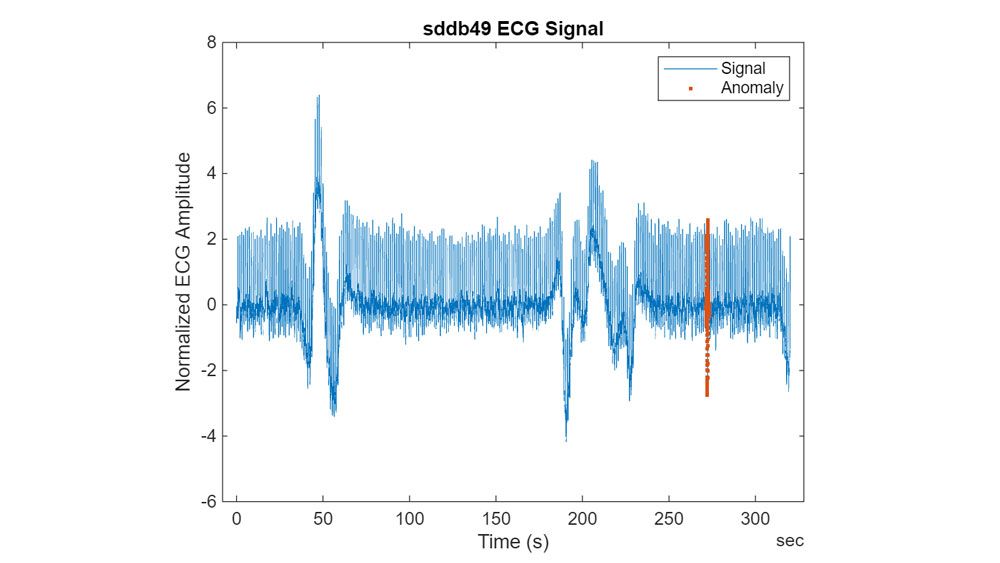
ECG data with detected anomaly shown in red.
Preparing Data for Anomaly Detection
Quality data is critical for building accurate anomaly detection algorithms. But collecting, exploring, and preprocessing data for anomaly detection is challenging—and not a one-size-fits-all approach. The techniques you apply depend on the data characteristics, hardware requirements, and the problem you’re trying to solve. Even with plenty of data, detecting anomalies can be difficult as the data comes from hundreds of noisy sensors. In these cases, extracting features and reducing data dimensions is essential.
Datasets for Anomaly Detection
Anomaly detection has flexible training data requirements compared to many traditional machine learning tasks—you don’t need labeled data. Anomaly detection algorithms are trained only on normal data or mostly normal data with some anomalies mixed in. With this type of data, you need to train an anomaly detection model to recognize what is normal—anything that isn’t normal is classified as an anomaly.
If you have a balanced, labeled dataset with two or more classes, apply an approach called supervised learning for multiclass fault detection.

Data suitable for anomaly detection.
Learn more about these approaches:
Exploring and Preprocessing Data
Before designing an algorithm, you need to understand what your data is telling you. Exploring and visualizing your data helps identify useful data sources, discern data patterns, reveal data quality, and determine necessary preprocessing steps. You can use the Signal Analyzer app to interactively explore and preprocess time series data.
Data collected from sensors is usually noisy, messy, and disorganized. There are numerous techniques and interactive apps in MATLAB for preprocessing steps like resampling, smoothing, organizing, filling missing data, and more.
Learn more about data preprocessing in MATLAB:
Extracting Features from Raw Data
While some AI models can operate directly on time series data, extracting features from data can improve model performance by highlighting the most important quantities that differentiate between normal and anomalous data. Feature extraction involves transforming raw data into meaningful numerical features that you can use to train a model.
For example, you might compute features like the mean, standard deviation, peak amplitude, or dominant frequency. These features summarize important behaviors in the time series data, making it easier for the model to learn what normal looks like.
Engineers familiar with their data often already know the most useful features to use. However, you can use the automated feature extraction process, which extracts common features (descriptive statistics, spectral measurements, and more) and then ranks them. The Diagnostic Feature Designer app in Predictive Maintenance Toolbox can help you extract, compare, and rank features interactively, then use these features to train an AI model.
Reducing Data Dimensionality
After collecting data and extracting features, it's common to end up with a huge number of them—sometimes hundreds per signal. This high dimensionality can make models slower to train, harder to interpret, and more prone to overfitting. Reducing dimensionality by selecting or combining only the most informative features helps simplify the model and focus the model training on the key features that indicate anomalies. Dimensionality reduction techniques, like Principal Component Analysis (PCA) or feature ranking, can help identify which features contribute most to anomaly detection.

Explore an example
Detect anomalies in industrial machinery using three-axis vibration data
This real-world example trains three different one-class AI models. The process includes data exploration, feature extraction, training the models, and evaluating their performance.
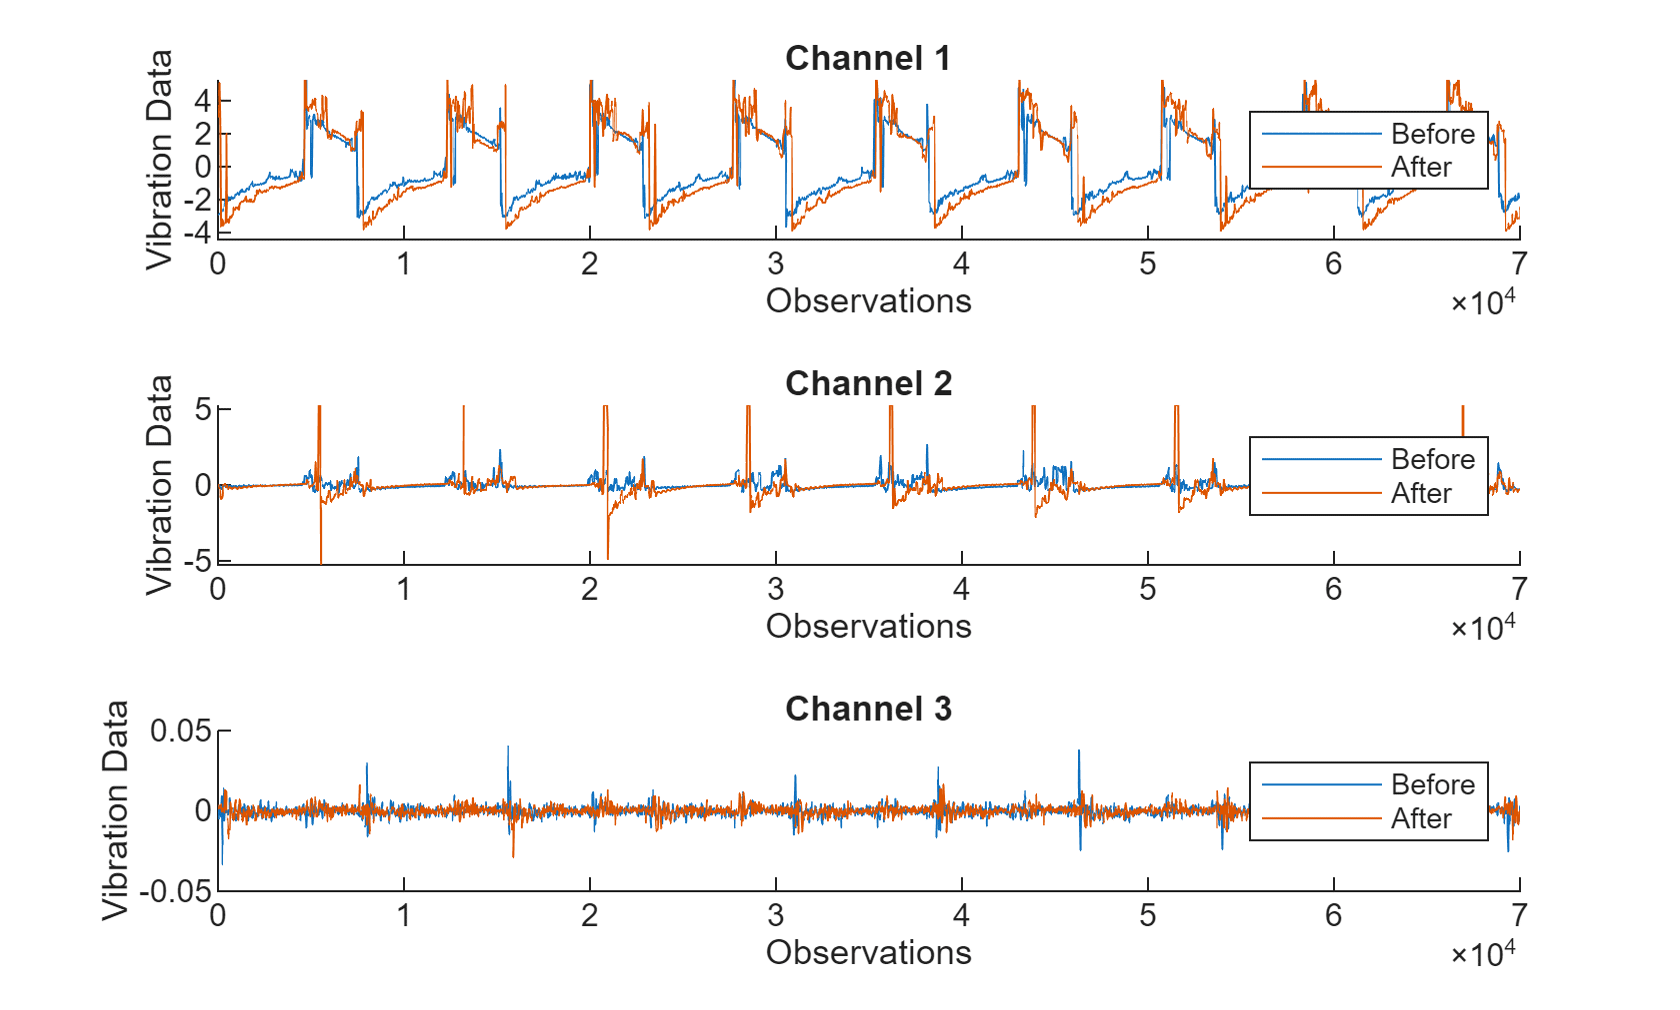
Three-axis vibration data before and after maintenance on industrial equipment. The data after maintenance represents normal operation, while the data right before maintenance is an anomaly.
Implementation for the Real World
Engineers want to design anomaly detection algorithms so they can detect anomalies in real systems. Developing these algorithms is an iterative process.
This guide covers essential steps for developing an anomaly detection algorithm: exploring and preprocessing data, extracting features, and choosing algorithms. After development, you can evaluate the algorithm on new data to ensure it generalizes well. Finally, you can deploy it for real-time use and update it as needed with incremental learning.

Workflow of developing and deploying AI model-based anomaly detection model for real-world applications.
Deploying to Embedded Hardware
With MATLAB for Embedded AI, you can create Simulink blocks or generate C/C++ code to deploy anomaly detection algorithms to embedded devices (such as a microcontroller or ECU) for real-time anomaly detection. It is important to test these algorithms in simulation to ensure their effectiveness before deploying them to embedded hardware. Simulink provides a platform for integrating anomaly detection algorithms with other system components, enabling system-level real-time simulations.
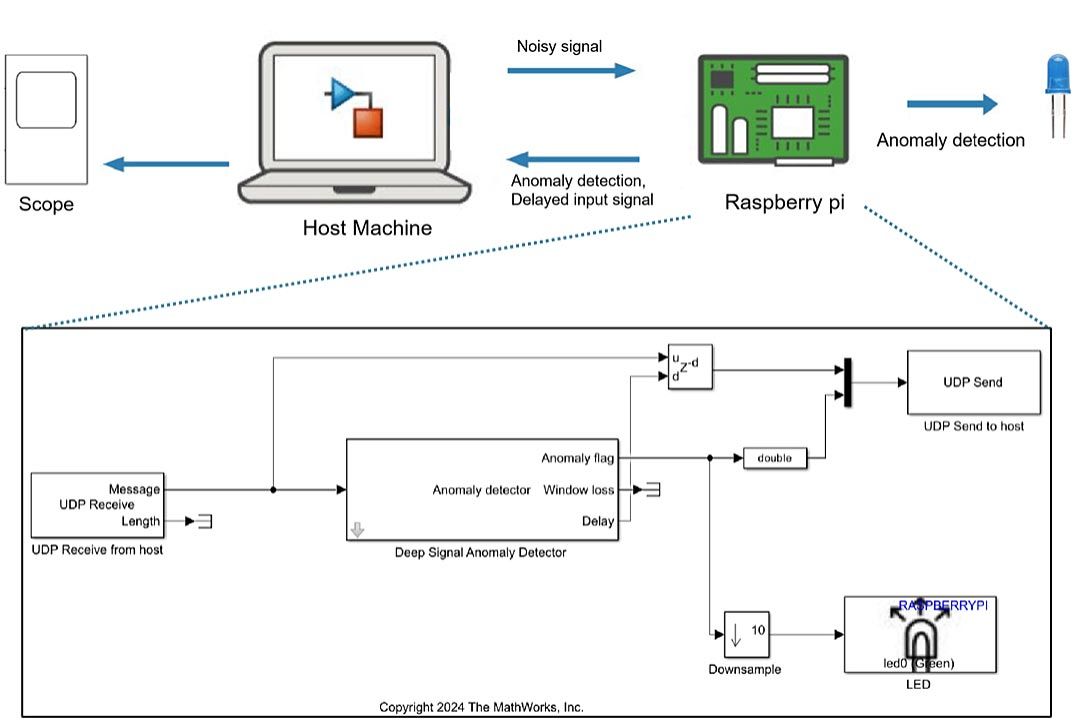
Deploying a Deep Signal Anomaly Detector Simulink block to Raspberry Pi® for real-time noise detection.
Incremental Anomaly Detection
Incremental anomaly detection methods continuously process incoming data and compute anomaly scores from a data stream in real time. An incremental model fits on data. MATLAB provides incrementalRobustRandomCutForest and incrementalOneClassSVM model objects for incremental anomaly detection. First, a model is trained to calculate an anomaly score. Then, the threshold is calculated and adjusted based on the anomaly score obtained from data used for training. The model will further detect anomalies, retrain itself, and adjust the threshold as new batches of data stream in.
Learn more about incremental anomaly detection.
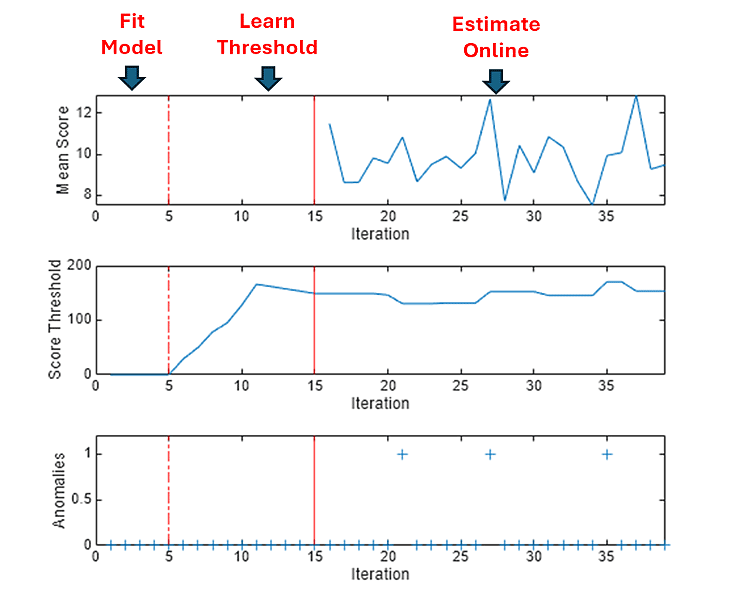
Model fitting, threshold learning, and online estimating stages of applying incremental learning techniques with time series data.
Key Takeaways
Time series anomaly detection involves identifying deviations from expected patterns, which can signal critical issues such as machine faults, health risks, or process inefficiencies. MATLAB provides a complete workflow for detecting anomalies in time series data, including data exploration and preprocessing, dimensionality reduction and feature extraction, and selecting appropriate algorithms. With Simulink, you can integrate anomaly detection algorithms into larger system models to verify overall system behavior through simulation. The workflow also supports embedded deployment, enabling you to generate C/C++ code to deploy anomaly detection algorithms on edge devices or in real-time applications.
Discover more about anomaly detection and predictive maintenance.
Keep exploring this topic
Select a Web Site
Choose a web site to get translated content where available and see local events and offers. Based on your location, we recommend that you select: .
You can also select a web site from the following list
How to Get Best Site Performance
Select the China site (in Chinese or English) for best site performance. Other MathWorks country sites are not optimized for visits from your location.
Americas
- América Latina (Español)
- Canada (English)
- United States (English)
Europe
- Belgium (English)
- Denmark (English)
- Deutschland (Deutsch)
- España (Español)
- Finland (English)
- France (Français)
- Ireland (English)
- Italia (Italiano)
- Luxembourg (English)
- Netherlands (English)
- Norway (English)
- Österreich (Deutsch)
- Portugal (English)
- Sweden (English)
- Switzerland
- United Kingdom (English)

