State Street Global Advisors Develops Scoring Model to Bring Transparency to ESG Investing
“We were under tremendous time pressure and could not afford to wait around figuring out whether and how R-Factor™ could be built in Python, R, or another language. We needed to move fast, and with MATLAB and support from MathWorks consultants, we were able to deliver.”
Challenge
Provide ESG scores to enable institutional investors to make sustainable investing decisions
Solution
Work with MathWorks Consulting Services to accelerate the development of an ESG scoring model that incorporates a transparent materiality framework, national corporate governance codes, and metrics from multiple data providers
Results
- Months of development time saved
- Deadline met despite late framework changes
- Changes implemented in days, not weeks
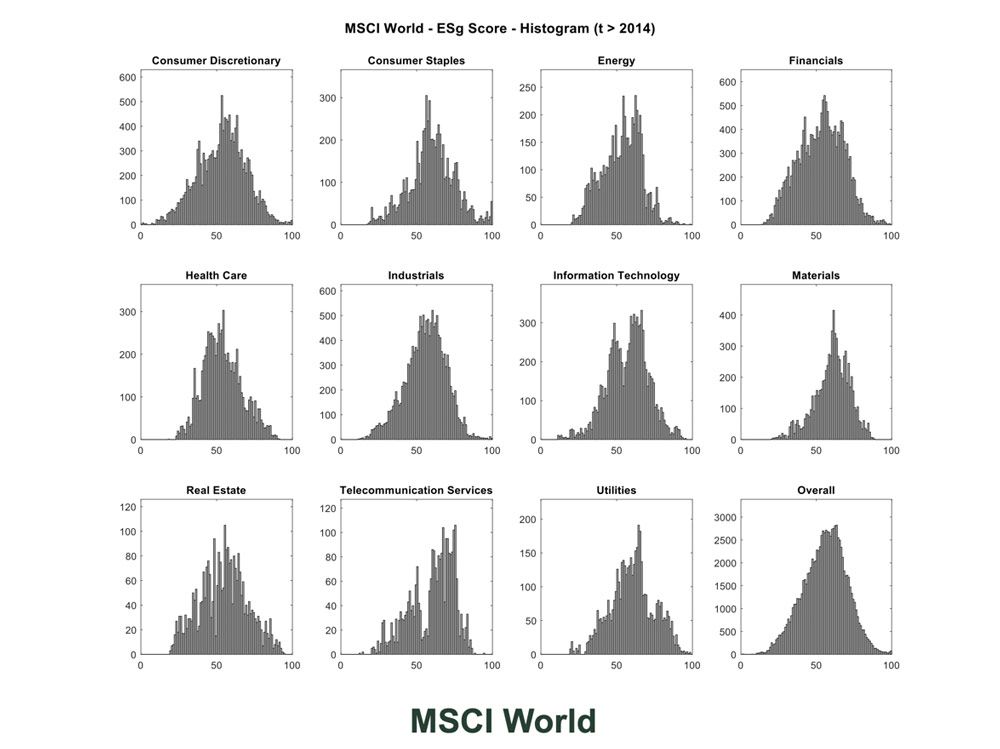
Histogram showing R-Factor™ ESG scores by industry.
Institutional investors are increasingly recognizing the positive effect that environmental, social, and governance (ESG) factors have on a business’s long-term performance and value. As a result, many investors now integrate these factors into their investment strategies. ESG data encompasses many dimensions, including executive and employee compensation, sustainability, human rights, animal welfare, and greenhouse emissions. Investors who rely on a single ESG data provider or on a scoring model based on proprietary standards, however, can access only a limited subset of this data and often do not have visibility into the factors affecting scoring.
To address this issue, State Street Global Advisors has created R-Factor™, an ESG scoring system that integrates guidelines from the Sustainability Accounting Standards Board (SASB), national corporate governance codes, and metrics from four data providers. Developed in MATLAB® with support from MathWorks Consulting Services, the R-Factor™ scoring system provides transparency that helps investors make informed decisions and enables companies to enhance their ESG scores.
“R-Factor™ incorporates well over 650 metrics from four data providers, two different analytical frameworks, five sustainability dimensions, 77 industry models, and 17 corporate governance models,” says Todd Bridges, Ph.D., ESG Research & Strategy Development at State Street Global Advisors. “MATLAB and the team from MathWorks enabled us to make sense of it all and to deliver a rigorous, transparent scoring model that is now generating results that State Street Global Advisors uses for 5,500+ companies worldwide.”
Challenge
First, the R-Factor™ research and development team had to transform and aggregate ESG data from four providers into a form that could be used in a quantitative scoring model. This involved preprocessing and cleaning the data, joining tables, rescaling and normalizing values, parsing textual data, and handling missing data and outliers. For preliminary analysis, the team also needed to generate a variety of plots to track a single company’s scores over time, compare scores across providers, and visualize groupings and correlations.
Once they had developed data preprocessing algorithms, the team needed to build a scoring model that maps financially material metrics across 77 industries and 17 governance regimes. They wanted the ability to update or extend the model to, for example, incorporate a fifth data provider, add new metrics, or calibrate weightings.
State Street Global Advisors executive and senior management had prioritized the project, both to meet the growing demand for sustainable investing and to deliver an ESG scoring system before competitors. The R-Factor™ developers wanted enterprise-level support to ensure rapid progress and minimize delays.
Solution
State Street Global Advisors engaged MathWorks Consulting Services to accelerate the development of the R-Factor™ scoring system.
Working in MATLAB, a team of State Street Global Advisors quantitative analysts and MathWorks consultants imported CSV files containing data from ESG data providers. (Later, they used an IBM® Netezza® database to retrieve this data.) They developed a preprocessing algorithm to identify and correct for outliers and missing data. Additional algorithms were developed to normalize metrics values across data providers and to process qualitative data, which was represented as text strings rather than as numeric values.
Using MATLAB table join capabilities, they grouped and aggregated data from multiple tables, including tables containing time series data captured over multiple months and a table for mapping metrics to specific industries.
Using this mapping table with the SASB sustainability framework and national governance standards, they implemented the R-Factor™ scoring model in MATLAB with Statistics and Machine Learning Toolbox™. The team used Database Toolbox™ to store results from the model in the IBM database.
Throughout development, the team generated histograms, scatter plots, box plots, and other visualizations to refine and test their preprocessing algorithms and scoring model.
The R-Factor™ scoring model has been validated by State Street Global Advisors risk and model validation teams and is being shared across the company’s fundamental growth, fundamental value, beta, smart beta, fixed income cash currency, and active quantitative investment teams. Additionally, R-Factor™ scores will be shared across State Street Corporation’s global exchange and global services groups.
Results
- Months of development time saved. “When we started, senior management told us they needed R-Factor™ designed and built yesterday,” says Bridges. “MATLAB saved us months of development time; without it the project would have been delayed by half a year or more.”
- Deadline met despite late framework changes. “When we were almost done with the initial version of the model, the SASB materiality framework completely changed,” says Stefano Maffina, ESG analyst at State Street Global Advisors. “MathWorks consultants were instrumental in helping us make the necessary updates to our model and still meet our deadline.”
- Changes implemented in days, not weeks. “From the outset we worked with MathWorks consultants to develop a scoring model that was flexible and scalable,” says Maffina. “With their help, last-minute updates that could have taken two or three weeks to implement were completed in a matter of days.”
Select a Web Site
Choose a web site to get translated content where available and see local events and offers. Based on your location, we recommend that you select: United States.
You can also select a web site from the following list
Americas
- América Latina (Español)
- Canada (English)
- United States (English)
Europe
- Belgium (English)
- Denmark (English)
- Deutschland (Deutsch)
- España (Español)
- Finland (English)
- France (Français)
- Ireland (English)
- Italia (Italiano)
- Luxembourg (English)
- Netherlands (English)
- Norway (English)
- Österreich (Deutsch)
- Portugal (English)
- Sweden (English)
- Switzerland
- United Kingdom (English)